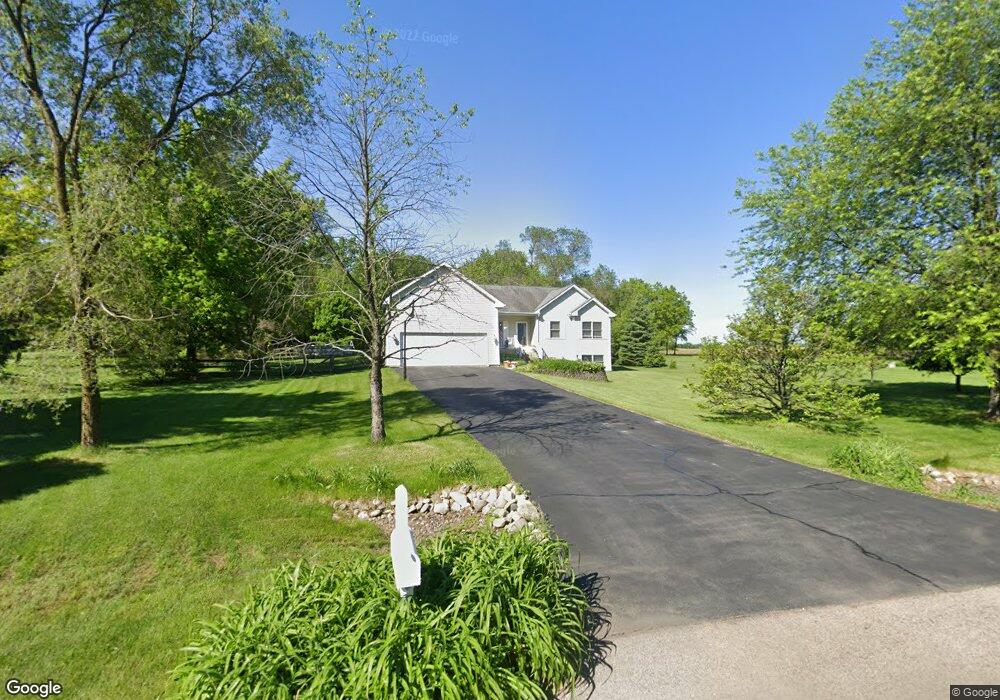
6301 Anvil Rd Crystal Lake, IL 60012
Estimated Value: $422,655 - $455,000
3
Beds
4
Baths
1,625
Sq Ft
$270/Sq Ft
Est. Value
About This Home
This home is located at 6301 Anvil Rd, Crystal Lake, IL 60012 and is currently estimated at $439,164, approximately $270 per square foot. 6301 Anvil Rd is a home located in McHenry County with nearby schools including North Elementary School, Hannah Beardsley Middle School, and Prairie Ridge High School.
Ownership History
Date
Name
Owned For
Owner Type
Purchase Details
Closed on
Apr 14, 2004
Sold by
Wilson John and Wilson Juanita
Bought by
Grantham David and Grantham Karen Dunne
Current Estimated Value
Home Financials for this Owner
Home Financials are based on the most recent Mortgage that was taken out on this home.
Original Mortgage
$254,250
Outstanding Balance
$119,647
Interest Rate
5.66%
Mortgage Type
Unknown
Estimated Equity
$319,517
Purchase Details
Closed on
Jun 4, 2001
Sold by
D L Orgler Inc
Bought by
Wilson John and Wilson Juanita
Home Financials for this Owner
Home Financials are based on the most recent Mortgage that was taken out on this home.
Original Mortgage
$183,000
Interest Rate
7.25%
Purchase Details
Closed on
Jun 20, 2000
Sold by
Verden Susan L and Saley Susan L
Bought by
D L Orgler Inc
Purchase Details
Closed on
Sep 1, 1995
Sold by
Saley Mark J
Bought by
Verden Susan L
Purchase Details
Closed on
Sep 9, 1994
Sold by
Saley Mark J
Bought by
Saley Susan L
Create a Home Valuation Report for This Property
The Home Valuation Report is an in-depth analysis detailing your home's value as well as a comparison with similar homes in the area
Home Values in the Area
Average Home Value in this Area
Purchase History
| Date | Buyer | Sale Price | Title Company |
|---|---|---|---|
| Grantham David | $282,500 | Universal Title Services Inc | |
| Wilson John | $224,721 | Plm Title Company | |
| D L Orgler Inc | $51,500 | -- | |
| Verden Susan L | -- | -- | |
| Saley Susan L | -- | -- |
Source: Public Records
Mortgage History
| Date | Status | Borrower | Loan Amount |
|---|---|---|---|
| Open | Grantham David | $254,250 | |
| Previous Owner | Wilson John | $183,000 |
Source: Public Records
Tax History Compared to Growth
Tax History
| Year | Tax Paid | Tax Assessment Tax Assessment Total Assessment is a certain percentage of the fair market value that is determined by local assessors to be the total taxable value of land and additions on the property. | Land | Improvement |
|---|---|---|---|---|
| 2024 | $7,356 | $108,154 | $28,249 | $79,905 |
| 2023 | $8,176 | $110,189 | $33,452 | $76,737 |
| 2022 | $7,765 | $100,768 | $30,592 | $70,176 |
| 2021 | $7,378 | $94,476 | $28,682 | $65,794 |
| 2020 | $7,267 | $91,644 | $27,822 | $63,822 |
| 2019 | $7,010 | $87,131 | $26,452 | $60,679 |
| 2018 | $7,393 | $89,823 | $24,847 | $64,976 |
| 2017 | $7,481 | $86,053 | $23,804 | $62,249 |
| 2016 | $7,454 | $82,104 | $22,712 | $59,392 |
| 2013 | -- | $78,138 | $21,615 | $56,523 |
Source: Public Records
Map
Nearby Homes
- 6107 Coachlight Rd
- 2916 Skyline Dr
- 6605 Oakwood Manor Dr
- 2623 Cobblestone Dr
- 3218 Opengate Rd
- 2809 Jenny Jae Ln
- 3103 Stonegate Dr
- 3513 Deep Wood Dr
- Lot 0 Route 14 & 176
- 7615 Surini Ln
- 1907 Cherry Valley Rd
- 2002 S Illinois Route 31
- 3515 Oak Ridge Rd
- 7001 Foxfire Dr
- 8104 Mason Hill Rd
- 1510 S Illinois Route 31
- Lot 1 Crystal Springs Rd
- 5198 Bull Valley Rd
- 1100 S Illinois Route 31
- 1972 Concord Dr Unit 254
- 6219 Anvil Rd
- 6309 Anvil Rd
- 6211 Anvil Rd
- 2415 Walkup Rd
- 6210 Anvil Rd
- 6317 Anvil Rd
- 6202 Anvil Rd
- 6219 Coachlight Rd
- 6201 Anvil Rd
- 6313 Coachlight Rd
- 6310 Anvil Rd
- 6118 Anvil Rd
- 6319 Coachlight Rd
- 6211 Coachlight Rd
- 2317 Walkup Rd
- 6205 Coachlight Rd
- 6405 Coachlight Rd
- 6113 Anvil Rd
- 6119 Coachlight Rd
- 6224 Coachlight Rd