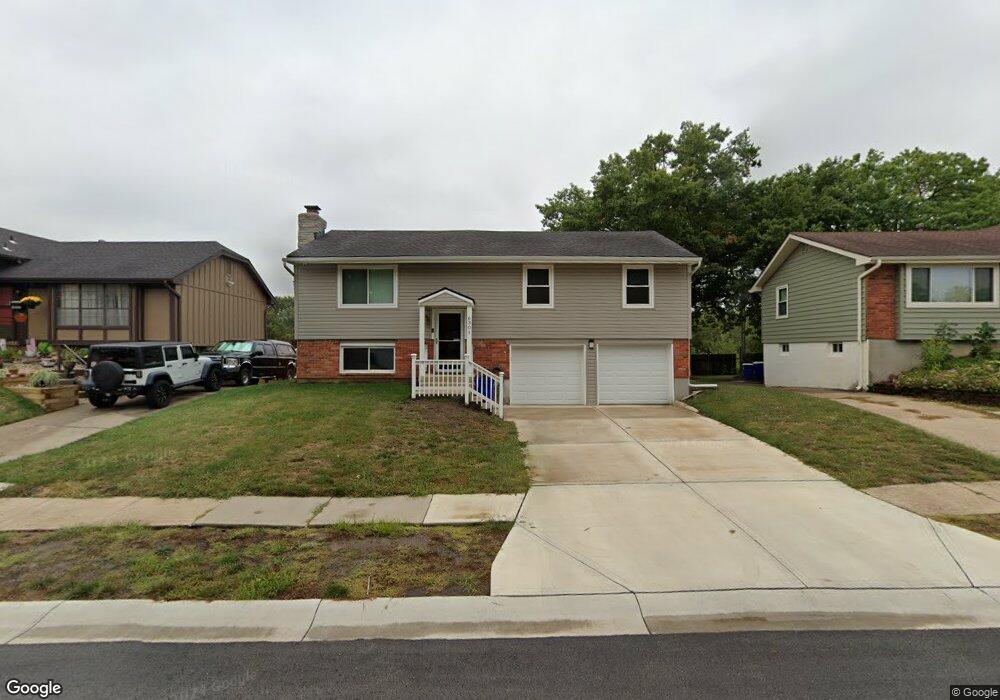
6301 E 140th Place Grandview, MO 64030
Estimated Value: $210,000 - $225,000
3
Beds
2
Baths
1,056
Sq Ft
$206/Sq Ft
Est. Value
About This Home
This home is located at 6301 E 140th Place, Grandview, MO 64030 and is currently estimated at $217,418, approximately $205 per square foot. 6301 E 140th Place is a home located in Jackson County with nearby schools including Butcher-Greene Elementary School, Grandview Middle, and Grandview High School.
Ownership History
Date
Name
Owned For
Owner Type
Purchase Details
Closed on
Dec 13, 2023
Sold by
Strong Renita Y
Bought by
Strong Renita Y and Strong Kevin Charles
Current Estimated Value
Purchase Details
Closed on
Dec 23, 2019
Sold by
Strong Darryl K and Strong Teresa
Bought by
Strong Darryl K and Strong Teresa
Home Financials for this Owner
Home Financials are based on the most recent Mortgage that was taken out on this home.
Original Mortgage
$119,047
Interest Rate
3.7%
Mortgage Type
FHA
Purchase Details
Closed on
Jun 27, 1996
Sold by
Waters Jeffrey L
Bought by
Strong Darryl K
Home Financials for this Owner
Home Financials are based on the most recent Mortgage that was taken out on this home.
Original Mortgage
$58,100
Interest Rate
8.1%
Mortgage Type
Purchase Money Mortgage
Create a Home Valuation Report for This Property
The Home Valuation Report is an in-depth analysis detailing your home's value as well as a comparison with similar homes in the area
Home Values in the Area
Average Home Value in this Area
Purchase History
| Date | Buyer | Sale Price | Title Company |
|---|---|---|---|
| Strong Renita Y | -- | None Listed On Document | |
| Strong Darryl K | -- | None Available | |
| Strong Darryl K | -- | Ati Title Company |
Source: Public Records
Mortgage History
| Date | Status | Borrower | Loan Amount |
|---|---|---|---|
| Previous Owner | Strong Darryl K | $119,047 | |
| Previous Owner | Strong Darryl K | $58,100 |
Source: Public Records
Tax History
| Year | Tax Paid | Tax Assessment Tax Assessment Total Assessment is a certain percentage of the fair market value that is determined by local assessors to be the total taxable value of land and additions on the property. | Land | Improvement |
|---|---|---|---|---|
| 2025 | $2,158 | $30,512 | $4,573 | $25,939 |
| 2024 | $2,121 | $26,534 | $6,965 | $19,569 |
| 2023 | $2,121 | $26,534 | $5,168 | $21,366 |
| 2022 | $2,170 | $25,270 | $4,142 | $21,128 |
| 2021 | $2,168 | $25,270 | $4,142 | $21,128 |
| 2020 | $1,942 | $23,974 | $4,142 | $19,832 |
| 2019 | $1,872 | $23,974 | $4,142 | $19,832 |
| 2018 | $1,120 | $13,347 | $1,952 | $11,395 |
| 2016 | $1,115 | $13,013 | $2,640 | $10,373 |
Source: Public Records
Map
Nearby Homes
- 6206 E 140th Terrace
- 13917 Falkirk Cir
- 13907 Falkirk Cir
- 13801 Lowell Ave
- 13908 Dundee Cir
- 13920 Dundee Cir
- 14100 Merrywood Ln
- 6906 E 140th Place
- 14051 Dunbar Ct
- 6810 E 143rd St
- 13628 Applewood Dr
- 14401 Saint Andrews Dr
- 13729 S U S 71 Hwy
- 13616 Winchester Ave
- 6813 E 144th Place
- 6104 E 136th St
- 14417 Saint Andrews Dr
- 14417 Craig Ave
- 13501 Applewood Dr
- 13420 Belmeade Ave
- 6303 E 140th Place
- 6205 E 140th Place
- 6305 E 140th Place
- 6401 E 140th Place
- 6203 E 140th Place
- 6202 E 140th Place
- 6300 E 140th Place
- 6200 E 140th Place
- 6302 E 140th Place
- 6201 E 140th Terrace
- 6403 E 140th Place
- 6400 E 140th Place
- 6402 E 140th Place
- 6203 E 140th Terrace
- 6205 E 140th Terrace
- 6405 E 140th Place
- 6301 E 140th Terrace
- 6113 E 140th Place
- 6404 E 140th Place
- 6303 E 140th Terrace
Your Personal Tour Guide
Ask me questions while you tour the home.