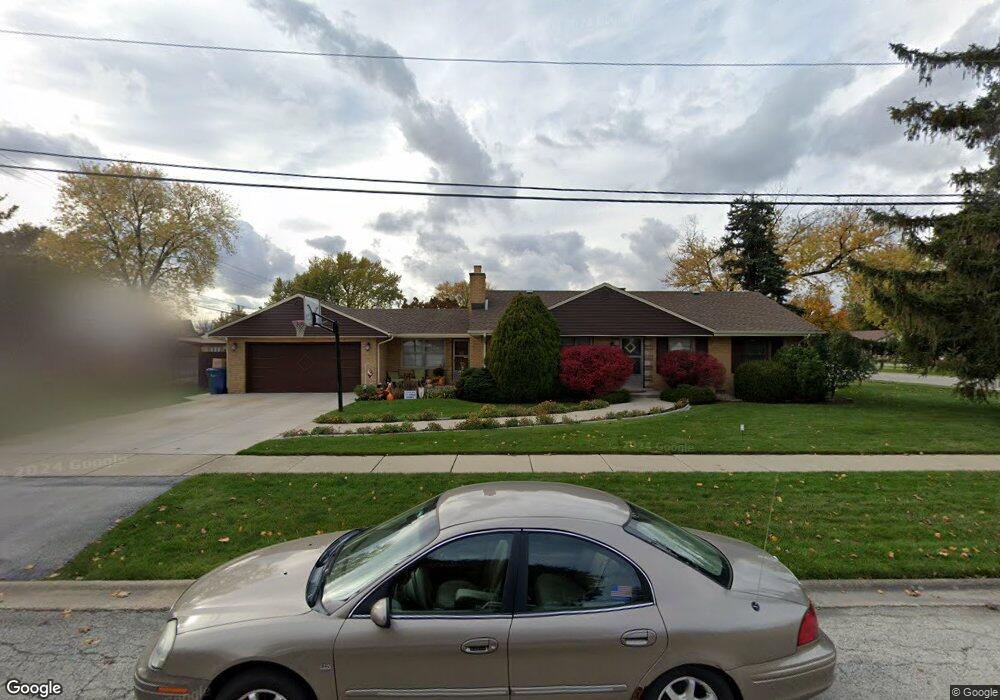
6301 W 90th St Oak Lawn, IL 60453
Estimated Value: $296,058 - $325,000
3
Beds
2
Baths
1,430
Sq Ft
$220/Sq Ft
Est. Value
About This Home
This home is located at 6301 W 90th St, Oak Lawn, IL 60453 and is currently estimated at $314,765, approximately $220 per square foot. 6301 W 90th St is a home located in Cook County with nearby schools including Harnew Elementary School, Simmons Middle School, and Oak Lawn Community High School.
Ownership History
Date
Name
Owned For
Owner Type
Purchase Details
Closed on
Jan 20, 2023
Sold by
Jankuski Gail Ann
Bought by
Gray Dawn Jankuski and Phillips Joseph T
Current Estimated Value
Purchase Details
Closed on
Dec 29, 2020
Sold by
Mroz Edmund and Mroz Jennifer T
Bought by
Mroz Edmund and Mroz Jennifer T
Purchase Details
Closed on
Mar 1, 1999
Sold by
Martyn Eugene and Mroz Edmund
Bought by
Mroz Edmund and Mroz Jennifer T
Home Financials for this Owner
Home Financials are based on the most recent Mortgage that was taken out on this home.
Original Mortgage
$148,978
Outstanding Balance
$36,302
Interest Rate
6.83%
Mortgage Type
FHA
Estimated Equity
$278,463
Purchase Details
Closed on
Sep 15, 1995
Sold by
Mccann Tammy J
Bought by
Martyn Eugene and Martyn Jennifer T
Home Financials for this Owner
Home Financials are based on the most recent Mortgage that was taken out on this home.
Original Mortgage
$116,000
Interest Rate
7.65%
Create a Home Valuation Report for This Property
The Home Valuation Report is an in-depth analysis detailing your home's value as well as a comparison with similar homes in the area
Home Values in the Area
Average Home Value in this Area
Purchase History
| Date | Buyer | Sale Price | Title Company |
|---|---|---|---|
| Gray Dawn Jankuski | -- | Truly Title | |
| Mroz Edmund | -- | Attorney | |
| Mroz Edmund | -- | -- | |
| Martyn Eugene | $133,000 | Attorneys Natl Title Network |
Source: Public Records
Mortgage History
| Date | Status | Borrower | Loan Amount |
|---|---|---|---|
| Open | Mroz Edmund | $148,978 | |
| Previous Owner | Martyn Eugene | $116,000 |
Source: Public Records
Tax History Compared to Growth
Tax History
| Year | Tax Paid | Tax Assessment Tax Assessment Total Assessment is a certain percentage of the fair market value that is determined by local assessors to be the total taxable value of land and additions on the property. | Land | Improvement |
|---|---|---|---|---|
| 2024 | $5,771 | $23,174 | $6,572 | $16,602 |
| 2023 | $5,399 | $23,174 | $6,572 | $16,602 |
| 2022 | $5,399 | $18,793 | $5,715 | $13,078 |
| 2021 | $5,262 | $18,793 | $5,715 | $13,078 |
| 2020 | $5,232 | $18,793 | $5,715 | $13,078 |
| 2019 | $5,286 | $19,710 | $5,143 | $14,567 |
| 2018 | $5,063 | $19,710 | $5,143 | $14,567 |
| 2017 | $5,154 | $19,710 | $5,143 | $14,567 |
| 2016 | $3,585 | $13,177 | $4,286 | $8,891 |
| 2015 | $4,156 | $15,096 | $4,286 | $10,810 |
| 2014 | $4,449 | $16,041 | $4,286 | $11,755 |
| 2013 | $4,360 | $17,127 | $4,286 | $12,841 |
Source: Public Records
Map
Nearby Homes
- 6313 W 89th Place
- 6346 W 90th St
- 9108 Crescent Ct
- 6455 W 88th Place
- 6541 Crescent Ct
- 8720 Mobile Ave Unit C
- 8848 Meade Ave
- 6442 W 88th St
- 8704 Mobile Ave Unit A
- 8758 Nashville Ave
- 8700 Ridgeland Ave
- 9100 Lynwood Dr
- 8803 Austin Ave
- 9208 Nashville Ave
- 8743 Austin Ave
- 6237 W 94th St Unit 3S
- 9258 Austin Ave
- 5905 W 89th St
- 5840 W 90th St
- 6409 W 85th Place
- 6307 W 90th St
- 6311 W 90th St
- 6300 W 90th Place
- 6310 W 90th Place
- 6300 W 90th St
- 6250 W 90th Place
- 6312 W 90th St
- 6324 W 90th Place
- 6241 W 90th St
- 6252 W 90th St
- 6326 W 90th St
- 6242 W 90th Place
- 6336 W 90th Place
- 6246 W 90th St
- 6235 W 90th St
- 6338 W 90th St
- 6236 W 90th Place
- 6251 W 89th Place
- 6345 W 90th St
- 6234 W 90th St