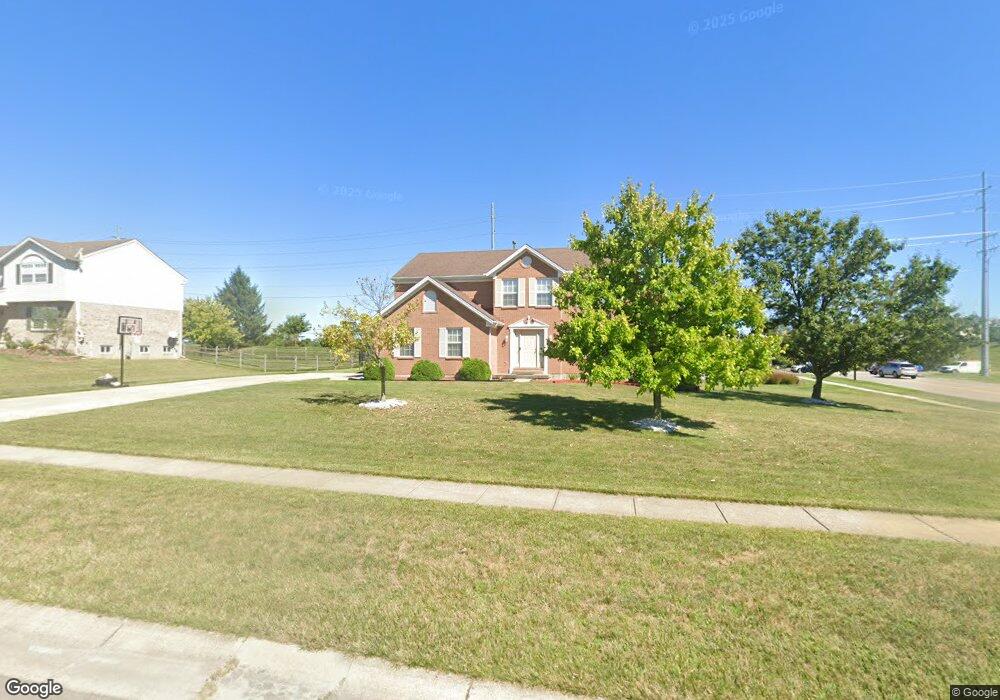
6302 Willow Brooke Dr Liberty Township, OH 45011
Estimated Value: $435,000 - $484,746
4
Beds
3
Baths
2,456
Sq Ft
$186/Sq Ft
Est. Value
About This Home
This home is located at 6302 Willow Brooke Dr, Liberty Township, OH 45011 and is currently estimated at $457,187, approximately $186 per square foot. 6302 Willow Brooke Dr is a home located in Butler County with nearby schools including Heritage Early Childhood School, Cherokee Elementary School, and Lakota Plains Junior School.
Ownership History
Date
Name
Owned For
Owner Type
Purchase Details
Closed on
Nov 19, 2015
Sold by
Dearmond David L
Bought by
Dearmond Charity
Current Estimated Value
Purchase Details
Closed on
May 27, 2010
Sold by
Vannguyen Uy and Nguyen Ngoan Thi
Bought by
Dearmond Charity
Home Financials for this Owner
Home Financials are based on the most recent Mortgage that was taken out on this home.
Original Mortgage
$158,100
Outstanding Balance
$106,787
Interest Rate
5.13%
Mortgage Type
New Conventional
Estimated Equity
$350,400
Purchase Details
Closed on
Dec 31, 2001
Sold by
Dixon Builders Llc
Bought by
Vanvannguyen Uy Van and Nguyen Ngoan Thi
Home Financials for this Owner
Home Financials are based on the most recent Mortgage that was taken out on this home.
Original Mortgage
$110,000
Interest Rate
6.5%
Mortgage Type
Unknown
Create a Home Valuation Report for This Property
The Home Valuation Report is an in-depth analysis detailing your home's value as well as a comparison with similar homes in the area
Home Values in the Area
Average Home Value in this Area
Purchase History
| Date | Buyer | Sale Price | Title Company |
|---|---|---|---|
| Dearmond Charity | -- | None Available | |
| Dearmond Charity | $186,000 | Service Title Llc | |
| Vanvannguyen Uy Van | $183,750 | -- |
Source: Public Records
Mortgage History
| Date | Status | Borrower | Loan Amount |
|---|---|---|---|
| Open | Dearmond Charity | $158,100 | |
| Previous Owner | Vanvannguyen Uy Van | $110,000 |
Source: Public Records
Tax History Compared to Growth
Tax History
| Year | Tax Paid | Tax Assessment Tax Assessment Total Assessment is a certain percentage of the fair market value that is determined by local assessors to be the total taxable value of land and additions on the property. | Land | Improvement |
|---|---|---|---|---|
| 2024 | $5,204 | $131,880 | $21,070 | $110,810 |
| 2023 | $5,137 | $128,230 | $21,070 | $107,160 |
| 2022 | $4,397 | $88,270 | $21,070 | $67,200 |
| 2021 | $4,374 | $88,270 | $21,070 | $67,200 |
| 2020 | $4,484 | $88,270 | $21,070 | $67,200 |
| 2019 | $7,695 | $79,880 | $18,910 | $60,970 |
| 2018 | $4,536 | $79,880 | $18,910 | $60,970 |
| 2017 | $4,608 | $79,880 | $18,910 | $60,970 |
| 2016 | $4,174 | $71,950 | $18,910 | $53,040 |
| 2015 | $4,135 | $71,950 | $18,910 | $53,040 |
| 2014 | $3,929 | $71,950 | $18,910 | $53,040 |
| 2013 | $3,929 | $65,100 | $17,020 | $48,080 |
Source: Public Records
Map
Nearby Homes
- 5001 Fescue Dr
- 4983 Fescue Dr
- 4832 Willow Ridge Dr
- 4970 Fescue Dr
- 4893 Arena Ct
- 4991 Arena Ct
- 5003 Arena Ct
- 4925 Fescue Dr
- 5011 Arena Ct
- 4864 Aspen Dr
- 5038 Maiden Way
- 5053 Maiden Way
- 4824 Aspen Dr
- 6406 Whippoorwill Way
- 6406 Whippoorwill Dr
- 4871 Imperial Dr
- 5934 Trotters Way
- 4628 Beech Knoll Ln
- 4600 Snowbird Dr
- 6075 Northlake Ct
- 6292 Willow Brooke Dr
- 6322 Willow Brooke Dr
- 6301 Willow Brooke Dr
- 6291 Willow Brooke Dr
- 6282 Willow Brooke Dr
- 6321 Willow Brooke Dr
- 4899 Willow Ridge Dr
- 6332 Willow Brooke Dr
- 4892 Willow Ridge Dr
- 6272 Willow Brooke Dr
- 6341 Willow Brooke Dr
- 0 Willow Ridge Dr Unit 1787877
- 0 Willow Ridge Dr
- 6 Willow Ridge Dr
- 10 Willow Ridge Dr
- 7 Willow Ridge Dr
- 331 Willow Ridge Dr
- 335 Willow Ridge Dr
- 327 Willow Ridge Dr
- 338 Willow Ridge Dr