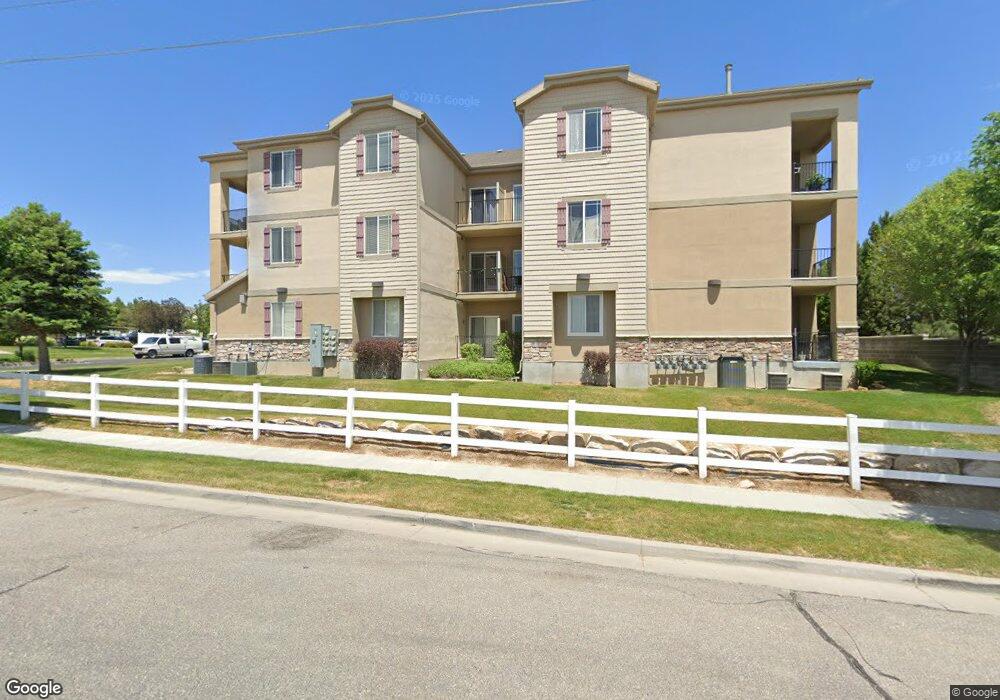
6304 Passenger Ln Unit E West Jordan, UT 84081
Oquirrh NeighborhoodEstimated Value: $345,529 - $377,000
3
Beds
2
Baths
1,212
Sq Ft
$295/Sq Ft
Est. Value
About This Home
This home is located at 6304 Passenger Ln Unit E, West Jordan, UT 84081 and is currently estimated at $358,132, approximately $295 per square foot. 6304 Passenger Ln Unit E is a home located in Salt Lake County with nearby schools including Falcon Ridge School, Sunset Ridge Middle School, and Copper Hills High School.
Ownership History
Date
Name
Owned For
Owner Type
Purchase Details
Closed on
Nov 10, 2015
Sold by
Linnell Dallan and Garcia Amy
Bought by
Garcia Amy
Current Estimated Value
Purchase Details
Closed on
Dec 7, 2009
Sold by
Olsen Kody J and Cole Stephanie A
Bought by
Linnell Dallan and Linnell Amy
Home Financials for this Owner
Home Financials are based on the most recent Mortgage that was taken out on this home.
Original Mortgage
$144,337
Outstanding Balance
$94,193
Interest Rate
4.91%
Mortgage Type
FHA
Estimated Equity
$263,939
Purchase Details
Closed on
Apr 7, 2005
Sold by
Oquirrh Highlands Condominiums Llc
Bought by
Olsen Kody J and Cole Stephanie A
Home Financials for this Owner
Home Financials are based on the most recent Mortgage that was taken out on this home.
Original Mortgage
$111,413
Interest Rate
6.02%
Mortgage Type
FHA
Create a Home Valuation Report for This Property
The Home Valuation Report is an in-depth analysis detailing your home's value as well as a comparison with similar homes in the area
Home Values in the Area
Average Home Value in this Area
Purchase History
| Date | Buyer | Sale Price | Title Company |
|---|---|---|---|
| Garcia Amy | -- | Title Source Inc | |
| Linnell Dallan | -- | Equity Title | |
| Olsen Kody J | -- | Us Title Of Utah |
Source: Public Records
Mortgage History
| Date | Status | Borrower | Loan Amount |
|---|---|---|---|
| Open | Linnell Dallan | $144,337 | |
| Previous Owner | Olsen Kody J | $111,413 |
Source: Public Records
Tax History Compared to Growth
Tax History
| Year | Tax Paid | Tax Assessment Tax Assessment Total Assessment is a certain percentage of the fair market value that is determined by local assessors to be the total taxable value of land and additions on the property. | Land | Improvement |
|---|---|---|---|---|
| 2025 | $2,224 | $333,300 | $100,000 | $233,300 |
| 2024 | $2,224 | $315,500 | $94,600 | $220,900 |
| 2023 | $2,345 | $315,800 | $94,700 | $221,100 |
| 2022 | $2,351 | $319,100 | $95,700 | $223,400 |
| 2021 | $1,786 | $228,100 | $68,400 | $159,700 |
| 2020 | $1,767 | $208,400 | $62,500 | $145,900 |
| 2019 | $1,626 | $191,200 | $57,300 | $133,900 |
| 2018 | $1,456 | $168,800 | $50,600 | $118,200 |
| 2017 | $1,376 | $157,300 | $47,200 | $110,100 |
| 2016 | $1,300 | $142,500 | $42,700 | $99,800 |
| 2015 | $1,287 | $135,600 | $40,700 | $94,900 |
| 2014 | $1,301 | $134,300 | $40,300 | $94,000 |
Source: Public Records
Map
Nearby Homes
- 6301 W Passenger Ln Unit 2
- 6364 W Passenger Ln
- 6150 W Nellies St
- 6761 S High Bluff Dr
- 6116 W Graceland Way
- 6880 S Mount Berry Rd Unit 410
- Lincoln Plan at Sky Ranch - Legacy
- Mckinley Plan at Sky Ranch - Legacy
- Washington Plan at Sky Ranch - Legacy
- Jefferson Plan at Sky Ranch - Legacy
- Buchanan Plan at Sky Ranch - Legacy
- Madison Plan at Sky Ranch - Legacy
- 6818 S Clever Peak Ln Unit 267
- 6818 S Clever Peak Ln
- 6816 S Mount Berry Rd
- 6826 S Clever Peak Ln Unit 265
- 6814 S Clever Peak Ln
- Stanford Plan at Sky Ranch - Enclave
- Yale Plan at Sky Ranch - Enclave
- Cambridge Plan at Sky Ranch - Enclave
- 6304 Passenger Ln Unit D
- 6304 Passenger Ln Unit C
- 6304 Passenger Ln Unit F
- 6304 Passenger Ln Unit A
- 6304 Passenger Ln Unit B
- 6304 Passenger Ln
- 6304 W Passenger Ln Unit 6
- 6955 S Tourist Ln Unit 7
- 6304 W Passenger Ln Unit 9
- 6955 S Tourist Ln Unit 11
- 6955 S Tourist Ln
- 6304 W Passenger Ln Unit 10
- 6955 S Tourist Ln Unit 3
- 6955 S Tourist Ln Unit C7
- 6304 W Passenger Ln Unit 5
- 6955 S Tourist Ln Unit C-12
- 6955 S Tourist Ln Unit B
- 6955 S Tourist Ln Unit 4
- 6304 W Passenger Ln Unit 1
- 6304 W Passenger Ln Unit 1 A