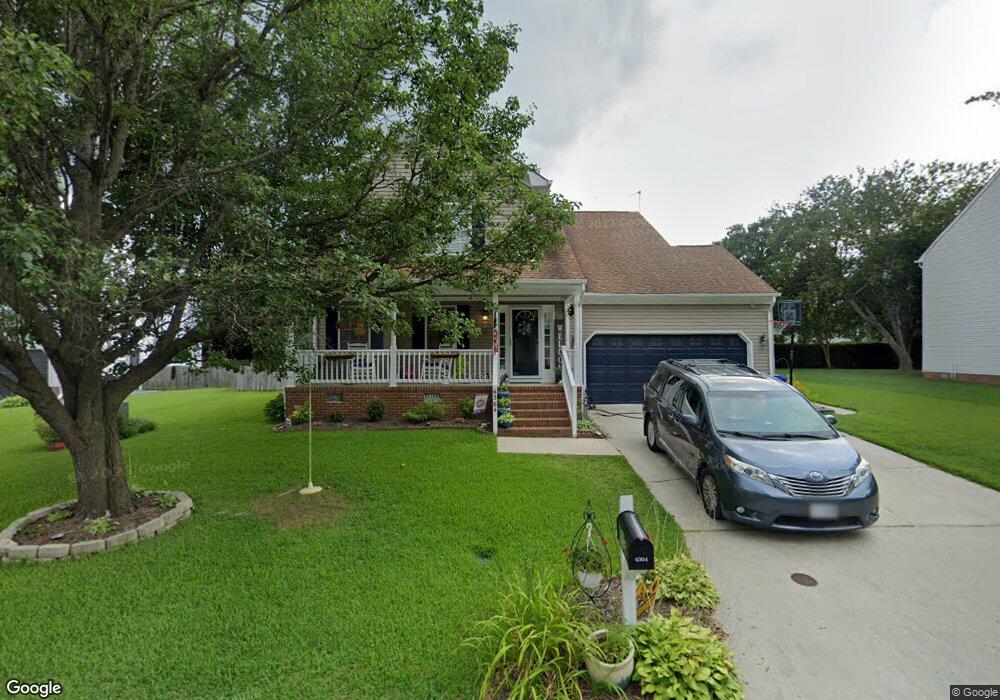
6304 Sentry Way S Suffolk, VA 23435
Nansemond NeighborhoodEstimated Value: $412,000 - $451,000
4
Beds
3
Baths
2,450
Sq Ft
$176/Sq Ft
Est. Value
About This Home
This home is located at 6304 Sentry Way S, Suffolk, VA 23435 and is currently estimated at $430,248, approximately $175 per square foot. 6304 Sentry Way S is a home located in Suffolk City with nearby schools including Northern Shores Elementary School, John Yeates Middle School, and Nansemond River High School.
Ownership History
Date
Name
Owned For
Owner Type
Purchase Details
Closed on
Nov 7, 2016
Sold by
Dye Joseph R and Dye Marie E
Bought by
Solmonoff Matthew G and Solmonoff Amanda G
Current Estimated Value
Home Financials for this Owner
Home Financials are based on the most recent Mortgage that was taken out on this home.
Original Mortgage
$255,150
Outstanding Balance
$203,580
Interest Rate
3.48%
Mortgage Type
VA
Estimated Equity
$226,668
Create a Home Valuation Report for This Property
The Home Valuation Report is an in-depth analysis detailing your home's value as well as a comparison with similar homes in the area
Home Values in the Area
Average Home Value in this Area
Purchase History
| Date | Buyer | Sale Price | Title Company |
|---|---|---|---|
| Solmonoff Matthew G | $280,000 | Home Title Of Virginia Llc |
Source: Public Records
Mortgage History
| Date | Status | Borrower | Loan Amount |
|---|---|---|---|
| Open | Solmonoff Matthew G | $255,150 |
Source: Public Records
Tax History
| Year | Tax Paid | Tax Assessment Tax Assessment Total Assessment is a certain percentage of the fair market value that is determined by local assessors to be the total taxable value of land and additions on the property. | Land | Improvement |
|---|---|---|---|---|
| 2025 | $4,481 | $376,700 | $85,000 | $291,700 |
| 2024 | $4,481 | $363,800 | $85,000 | $278,800 |
| 2023 | $4,286 | $344,300 | $85,000 | $259,300 |
| 2022 | $3,450 | $316,500 | $85,000 | $231,500 |
| 2021 | $3,062 | $275,900 | $72,600 | $203,300 |
| 2020 | $2,997 | $270,000 | $72,600 | $197,400 |
| 2019 | $2,910 | $262,200 | $72,600 | $189,600 |
| 2018 | $2,955 | $263,500 | $72,600 | $190,900 |
| 2017 | $2,819 | $263,500 | $72,600 | $190,900 |
| 2016 | $2,787 | $260,500 | $72,600 | $187,900 |
| 2015 | $1,262 | $253,800 | $65,900 | $187,900 |
| 2014 | $1,262 | $252,800 | $65,900 | $186,900 |
Source: Public Records
Map
Nearby Homes
- 6308 Sentry Way S
- 6215 Calvert Ct
- 6404 Pelican Crescent N
- 6205 Glenrose Dr
- 6812 Burbage Lake Cir
- 6218 Oakglen Dr
- 6302 Amberly Ct
- 6420 Aberdeen Place
- 6419 Olde Bullocks Cir
- 2018 Ashworth Way
- 2002 Ashworth Way
- 1018 Ashworth Way
- 1008 Ashworth Way
- 1016 Ashworth Way
- 5132 Duxbury Rd
- 2 Shoal Ct
- 6750 Burbage Landing Cir
- 10 Catamaran Ct
- 3705 Bamboo Rd
- 5109 Hoffler St
- 6302 Sentry Way S
- 6306 Sentry Way S
- 6300 Sentry Way S
- 6212 Calvert Ct
- 6303 Sentry Way S
- 6305 Sentry Way S
- 6210 Calvert Ct
- 6301 Sentry Way S
- 6214 Calvert Ct
- 6310 Sentry Way S
- 6307 Sentry Way S
- 6228 Glenrose Dr
- 6309 Sentry Way S
- 6107 Kent Ct
- 6208 Calvert Ct
- 6222 Calvert Ct
- 6302 Old Westham Dr S
- 6401 Sentry Way N
- 6226 Glenrose Dr
- 6300 Old Westham Dr S