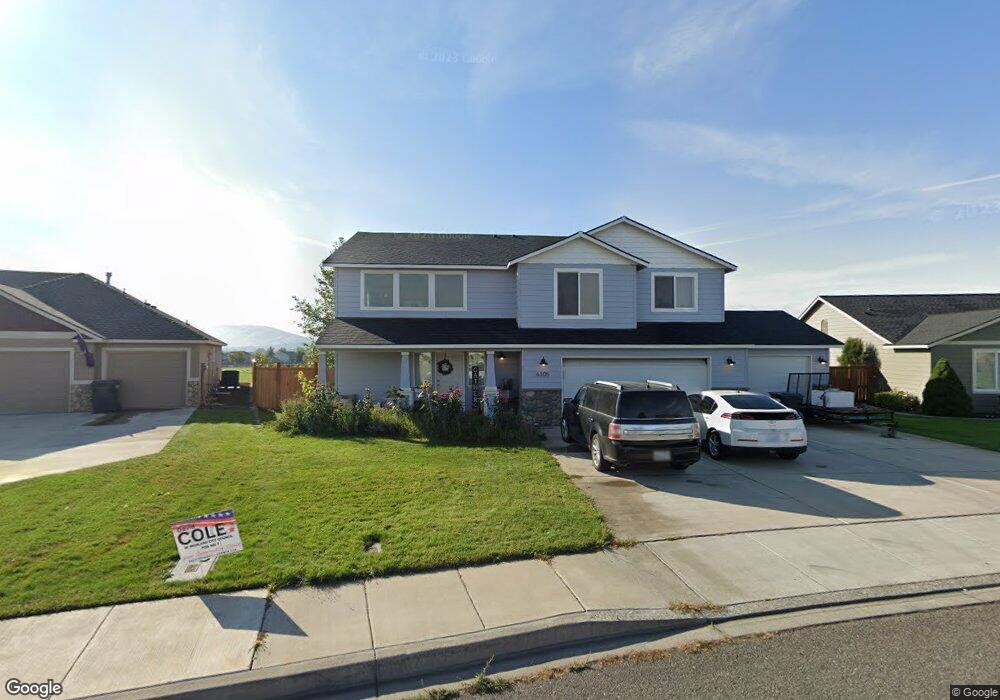
6305 Galena St Richland, WA 99352
Estimated Value: $516,000 - $634,000
3
Beds
3
Baths
2,500
Sq Ft
$231/Sq Ft
Est. Value
About This Home
This home is located at 6305 Galena St, Richland, WA 99352 and is currently estimated at $577,803, approximately $231 per square foot. 6305 Galena St is a home located in Benton County with nearby schools including White Bluffs Elementary School and Hanford High School.
Ownership History
Date
Name
Owned For
Owner Type
Purchase Details
Closed on
Mar 10, 2017
Sold by
Jacobsen Charles A and Jacobsen Lisa A
Bought by
Eylander Darrell J and Eylander Marilyn J
Current Estimated Value
Home Financials for this Owner
Home Financials are based on the most recent Mortgage that was taken out on this home.
Original Mortgage
$253,800
Outstanding Balance
$210,465
Interest Rate
4.17%
Mortgage Type
New Conventional
Estimated Equity
$367,338
Purchase Details
Closed on
Jul 11, 2008
Sold by
Olin Homes Llc
Bought by
Jacobsen Charles A and Jacobsen Lisa A
Home Financials for this Owner
Home Financials are based on the most recent Mortgage that was taken out on this home.
Original Mortgage
$224,956
Interest Rate
6.04%
Mortgage Type
FHA
Purchase Details
Closed on
Apr 1, 2008
Sold by
Swanson Parsons Llc
Bought by
Olin Homes Llc
Create a Home Valuation Report for This Property
The Home Valuation Report is an in-depth analysis detailing your home's value as well as a comparison with similar homes in the area
Home Values in the Area
Average Home Value in this Area
Purchase History
| Date | Buyer | Sale Price | Title Company |
|---|---|---|---|
| Eylander Darrell J | -- | Tri City Title & Escrow Llc | |
| Jacobsen Charles A | $228,487 | Benton Franklin Title Co | |
| Olin Homes Llc | $35,000 | Benton Franklin Title Co |
Source: Public Records
Mortgage History
| Date | Status | Borrower | Loan Amount |
|---|---|---|---|
| Open | Eylander Darrell J | $253,800 | |
| Previous Owner | Jacobsen Charles A | $224,956 |
Source: Public Records
Tax History Compared to Growth
Tax History
| Year | Tax Paid | Tax Assessment Tax Assessment Total Assessment is a certain percentage of the fair market value that is determined by local assessors to be the total taxable value of land and additions on the property. | Land | Improvement |
|---|---|---|---|---|
| 2024 | $5,239 | $532,190 | $50,000 | $482,190 |
| 2023 | $5,239 | $461,790 | $50,000 | $411,790 |
| 2022 | $4,826 | $382,090 | $50,000 | $332,090 |
| 2021 | $4,675 | $368,800 | $50,000 | $318,800 |
| 2020 | $4,491 | $342,240 | $50,000 | $292,240 |
| 2019 | $3,924 | $315,670 | $50,000 | $265,670 |
| 2018 | $3,880 | $293,910 | $50,000 | $243,910 |
| 2017 | $3,691 | $253,260 | $50,000 | $203,260 |
| 2016 | $3,529 | $253,260 | $50,000 | $203,260 |
| 2015 | $3,418 | $253,260 | $50,000 | $203,260 |
| 2014 | -- | $241,850 | $44,800 | $197,050 |
| 2013 | -- | $241,850 | $44,800 | $197,050 |
Source: Public Records
Map
Nearby Homes
- 6305 Galena Ave
- 6303 Galena St
- 6303 Galena Ave
- 6307 Galena Ave
- 6205 Kilawea Dr
- 6309 Galena St Unit This one is READY TO
- 6309 Galena Ave
- 6302 Galena Ave
- 6302 Galena St
- 6300 Galena Ave
- 6203 Kilawea Dr
- 6304 Galena St
- 6304 Galena Ave
- 6311 Galena Ave
- 6303 Kilawea Dr
- 6202 Kilawea Dr
- 6201 Kilawea Dr
- 6300 Kilawea Dr
- 6306 Galena St
- 6306 Galena Ave