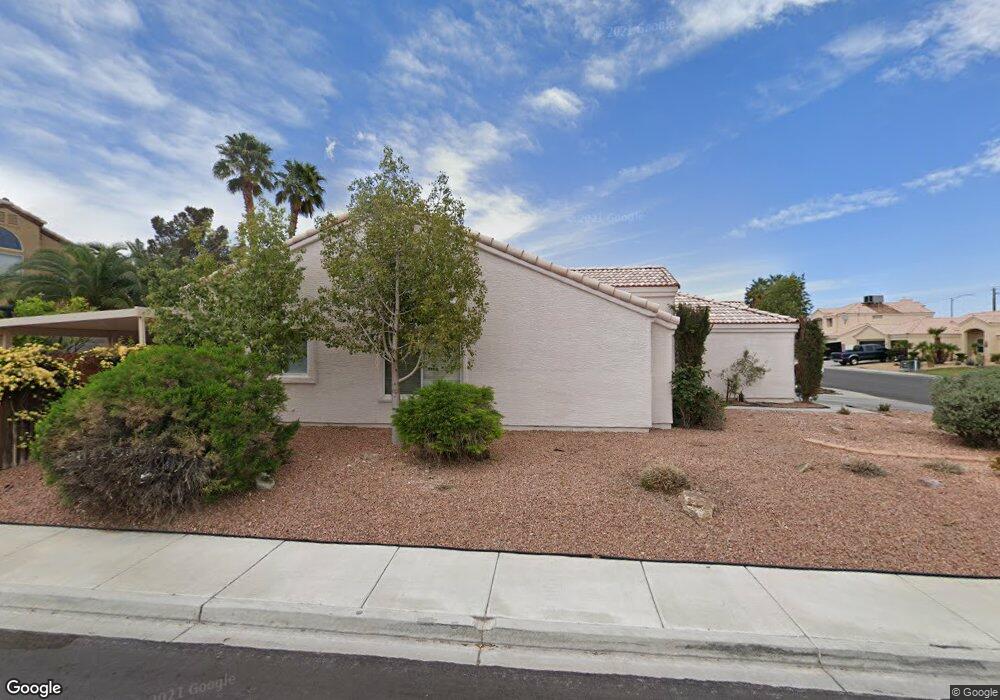
6305 Mint Frost Way Las Vegas, NV 89108
Michael Way NeighborhoodEstimated Value: $417,000 - $452,000
4
Beds
2
Baths
1,902
Sq Ft
$225/Sq Ft
Est. Value
About This Home
This home is located at 6305 Mint Frost Way, Las Vegas, NV 89108 and is currently estimated at $428,232, approximately $225 per square foot. 6305 Mint Frost Way is a home located in Clark County with nearby schools including Paul E. Culley Elementary School, Frank F Garside Junior High School, and Western High School.
Ownership History
Date
Name
Owned For
Owner Type
Purchase Details
Closed on
Aug 1, 2023
Sold by
Brooks Survivors Trust and Brooks Family Trust
Bought by
Brooks Paul L
Current Estimated Value
Purchase Details
Closed on
Mar 19, 2015
Sold by
Brooks Paul L
Bought by
Brooks Family Trust and Brooks Survivors Trust
Purchase Details
Closed on
Mar 16, 2000
Sold by
Brooks Paul L and Brooks Helen M
Bought by
Brooks Paul L and Brooks Helen M
Purchase Details
Closed on
Oct 6, 1997
Sold by
Stabler William B and Daines Gale R
Bought by
Brooks Paul L and Brooks Helen M
Home Financials for this Owner
Home Financials are based on the most recent Mortgage that was taken out on this home.
Original Mortgage
$93,000
Interest Rate
7.23%
Create a Home Valuation Report for This Property
The Home Valuation Report is an in-depth analysis detailing your home's value as well as a comparison with similar homes in the area
Home Values in the Area
Average Home Value in this Area
Purchase History
| Date | Buyer | Sale Price | Title Company |
|---|---|---|---|
| Brooks Paul L | -- | None Listed On Document | |
| Paul L Brooks Living Trust | -- | None Listed On Document | |
| Brooks Family Trust | -- | None Available | |
| Brooks Paul L | -- | -- | |
| Brooks Paul L | $140,000 | Old Republic Title Company | |
| Daines Gale R | -- | Old Republic Title Company |
Source: Public Records
Mortgage History
| Date | Status | Borrower | Loan Amount |
|---|---|---|---|
| Previous Owner | Daines Gale R | $93,000 |
Source: Public Records
Tax History Compared to Growth
Tax History
| Year | Tax Paid | Tax Assessment Tax Assessment Total Assessment is a certain percentage of the fair market value that is determined by local assessors to be the total taxable value of land and additions on the property. | Land | Improvement |
|---|---|---|---|---|
| 2025 | $1,536 | $85,512 | $28,350 | $57,162 |
| 2024 | $1,492 | $85,512 | $28,350 | $57,162 |
| 2023 | $1,492 | $81,686 | $28,000 | $53,686 |
| 2022 | $1,451 | $71,860 | $22,400 | $49,460 |
| 2021 | $1,410 | $68,327 | $21,000 | $47,327 |
| 2020 | $1,365 | $67,203 | $19,950 | $47,253 |
| 2019 | $1,325 | $63,262 | $16,450 | $46,812 |
| 2018 | $1,287 | $59,583 | $14,350 | $45,233 |
| 2017 | $1,891 | $59,010 | $12,950 | $46,060 |
| 2016 | $1,219 | $57,043 | $10,500 | $46,543 |
| 2015 | $1,258 | $45,183 | $5,950 | $39,233 |
| 2014 | $1,222 | $36,153 | $4,900 | $31,253 |
Source: Public Records
Map
Nearby Homes
- 6308 Mint Frost Way
- 6224 Mandarin Dr
- 1617 Joshua Tree Ct
- 6208 Mandarin Dr
- 6380 Mint Frost Way
- 1600 N Torrey Pines Dr Unit 202
- 1600 N Torrey Pines Dr Unit 101
- 1624 N Torrey Pines Dr Unit 104
- 1608 N Torrey Pines Dr Unit 103
- 1624 N Torrey Pines Dr Unit 101
- 1452 N Jones Blvd
- 6008 Pebble Beach Blvd
- 1706 N Jones Blvd
- 6205 Carmen Blvd
- 1336 N Jones Blvd
- 1816 N Torrey Pines Dr
- 1209 Shifting Sands Dr
- 1326 N Jones Blvd
- 6400 Starcrest Dr
- 6229 Saginaw Dr
- 6309 Mint Frost Way
- 6304 Sapphire Blue Ct
- 6308 Sapphire Blue Ct
- 6313 Mint Frost Way
- 1532 Valley Crest St
- 1528 Valley Crest St
- 6304 Mint Frost Way
- 1536 Valley Crest St
- 6300 Mint Frost Way
- 1524 Valley Crest St
- 6312 Mint Frost Way
- 6317 Mint Frost Way
- 1529 Daybreak Dr
- 6312 Sapphire Blue Ct
- 1520 Valley Crest St
- 6316 Mint Frost Way
- 6305 Sapphire Blue Ct
- 1525 Daybreak Dr
- 6309 Sapphire Blue Ct
- 1516 Valley Crest St