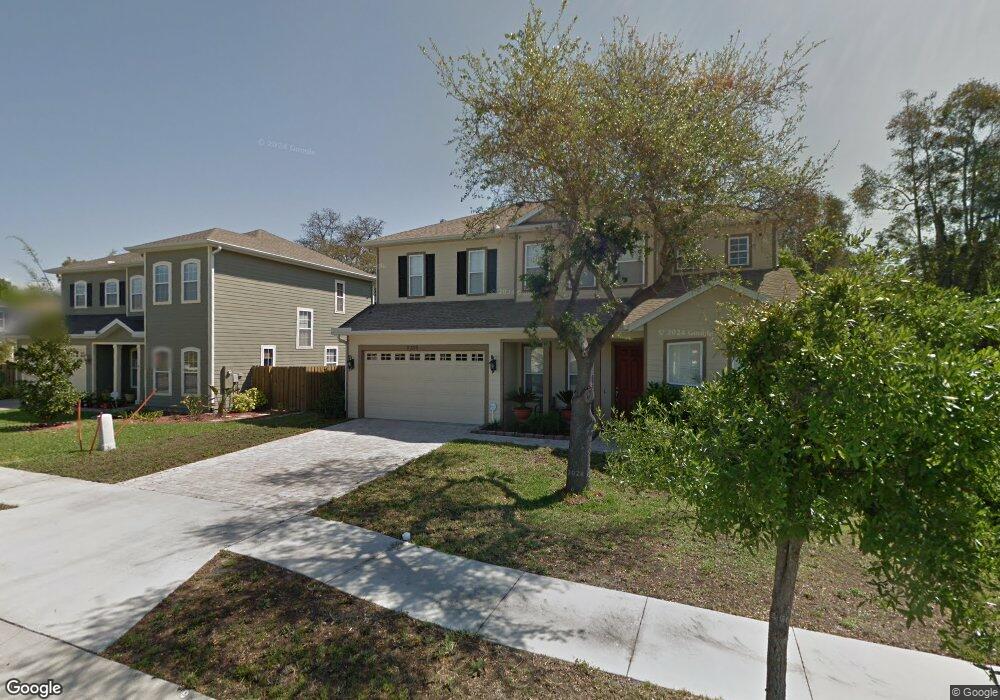
6306 Burdock Place Tampa, FL 33616
Sun Bay South NeighborhoodEstimated Value: $602,000 - $748,000
3
Beds
3
Baths
2,203
Sq Ft
$298/Sq Ft
Est. Value
About This Home
This home is located at 6306 Burdock Place, Tampa, FL 33616 and is currently estimated at $656,884, approximately $298 per square foot. 6306 Burdock Place is a home located in Hillsborough County with nearby schools including Westshore Elementary School, Monroe Middle School, and Robinson High School.
Ownership History
Date
Name
Owned For
Owner Type
Purchase Details
Closed on
Dec 17, 2018
Sold by
Tran Phuong Vy Vu
Bought by
Vo Hohg P and Tran Linh H
Current Estimated Value
Purchase Details
Closed on
Nov 19, 2018
Sold by
Tran Linh H and Vo Hong P
Bought by
Tran Phuong Vy Vu
Purchase Details
Closed on
Jun 18, 2010
Sold by
Blackburn Timothy Allen and Blacburn Jessica
Bought by
Vo Hong P and Tran Linh H
Home Financials for this Owner
Home Financials are based on the most recent Mortgage that was taken out on this home.
Original Mortgage
$150,000
Outstanding Balance
$99,638
Interest Rate
4.79%
Mortgage Type
New Conventional
Estimated Equity
$557,246
Purchase Details
Closed on
Apr 14, 2006
Sold by
Regency Palms Llc
Bought by
Blackburn Timothy Allen and Blackburn Jessica
Home Financials for this Owner
Home Financials are based on the most recent Mortgage that was taken out on this home.
Original Mortgage
$328,320
Interest Rate
6.87%
Mortgage Type
Fannie Mae Freddie Mac
Create a Home Valuation Report for This Property
The Home Valuation Report is an in-depth analysis detailing your home's value as well as a comparison with similar homes in the area
Home Values in the Area
Average Home Value in this Area
Purchase History
| Date | Buyer | Sale Price | Title Company |
|---|---|---|---|
| Vo Hohg P | -- | None Available | |
| Tran Phuong Vy Vu | -- | None Available | |
| Vo Hong P | $234,900 | Advantage Title Services Inc | |
| Blackburn Timothy Allen | $410,400 | Tampa Title Company |
Source: Public Records
Mortgage History
| Date | Status | Borrower | Loan Amount |
|---|---|---|---|
| Open | Vo Hong P | $150,000 | |
| Previous Owner | Blackburn Timothy Allen | $328,320 |
Source: Public Records
Tax History Compared to Growth
Tax History
| Year | Tax Paid | Tax Assessment Tax Assessment Total Assessment is a certain percentage of the fair market value that is determined by local assessors to be the total taxable value of land and additions on the property. | Land | Improvement |
|---|---|---|---|---|
| 2024 | $4,639 | $264,831 | -- | -- |
| 2023 | $4,524 | $257,117 | $0 | $0 |
| 2022 | $4,406 | $249,628 | $0 | $0 |
| 2021 | $4,351 | $242,357 | $0 | $0 |
| 2020 | $4,307 | $239,011 | $0 | $0 |
| 2019 | $4,226 | $233,637 | $0 | $0 |
| 2018 | $3,895 | $214,708 | $0 | $0 |
| 2017 | $3,836 | $294,890 | $0 | $0 |
| 2016 | $3,727 | $205,967 | $0 | $0 |
| 2015 | $3,718 | $204,535 | $0 | $0 |
| 2014 | $3,103 | $203,047 | $0 | $0 |
| 2013 | -- | $173,612 | $0 | $0 |
Source: Public Records
Map
Nearby Homes
- 6321 S Richard Ave
- 4008 W Olive St
- 4101 W Mango Ave
- 3902 W Elrod Ave
- 6321 S Harold Ave
- 6425 S Adelia Ave
- 6211 S Harold Ave
- 6209 S Harold Ave
- 6328 S Harold Ave
- 6412 S Cameron Ave
- 6407 S Cameron Ave
- 4114 W Olive St
- 4016 W Montgomery Terrace
- 6208 S Harold Ave
- 4111 W Marietta St
- 7001 Interbay Blvd Unit 346
- 7001 Interbay Blvd Unit 216
- 7001 Interbay Blvd Unit 229
- 7001 Interbay Blvd Unit 303
- 7001 Interbay Blvd Unit 119
- 6302 Burdock Place
- 4005 W Elrod Ave
- 6303 Burdock Place
- 6301 Burdock Place
- 6323 S Richard Ave
- 6325 S Richard Ave
- 4005 Southernwood Ct
- 4001 Southernwood Ct
- 4014 Southernwood Ct
- 4007 Southernwood Ct
- 4019 Southernwood Ct
- 4009 Southernwood Ct
- 4003 Southernwood Ct
- 4011 Southernwood Ct
- 6319 S Richard Ave
- 6401 S Richard Ave
- 6403 S Richard Ave
- 6317 S Richard Ave
- 4016 Southernwood Ct
- 6405 S Richard Ave