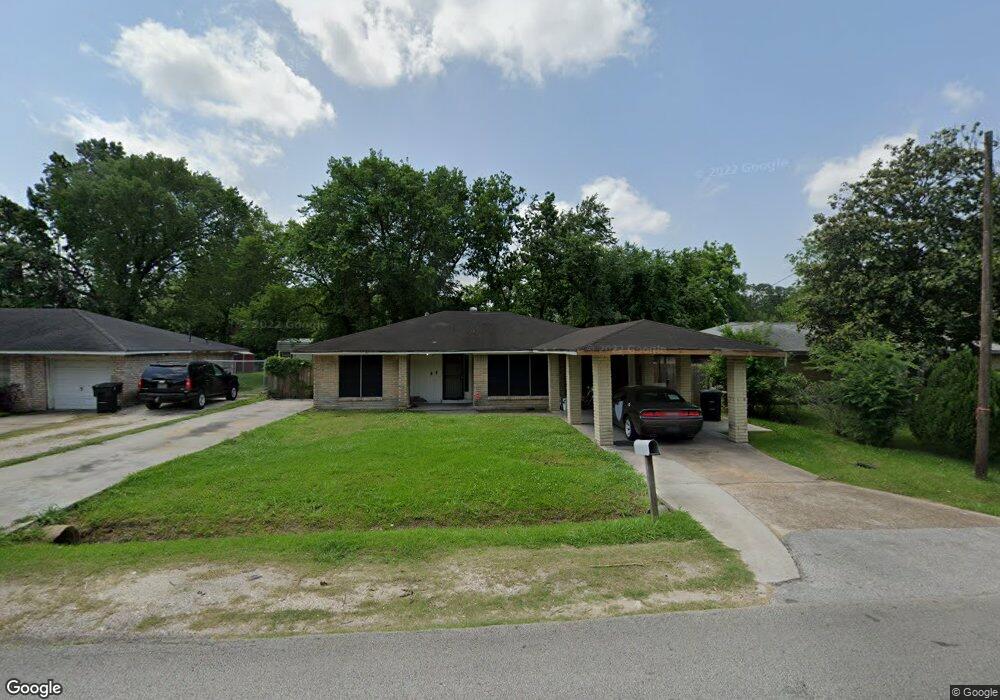
6306 Firnat St Houston, TX 77016
Trinity-Houston Gardens NeighborhoodEstimated Value: $155,000 - $191,000
3
Beds
2
Baths
1,783
Sq Ft
$99/Sq Ft
Est. Value
About This Home
This home is located at 6306 Firnat St, Houston, TX 77016 and is currently estimated at $177,224, approximately $99 per square foot. 6306 Firnat St is a home located in Harris County with nearby schools including Felix Cook Jr. Elementary School, Key Middle, and Kashmere High School.
Ownership History
Date
Name
Owned For
Owner Type
Purchase Details
Closed on
Aug 5, 2025
Sold by
Berntsen Kenneth
Bought by
Cpg Realty Management Llc
Current Estimated Value
Purchase Details
Closed on
Nov 27, 2012
Sold by
Vistamont Realty Management Inc
Bought by
Britton Terry Lamar and Kinnard Keisha M
Purchase Details
Closed on
Jul 3, 2012
Sold by
Bailey Shanta Monique
Bought by
Vistamont Realty Management Inc
Purchase Details
Closed on
Feb 10, 2012
Sold by
Vistamont Realty Management Inc
Bought by
Bailey Shanta Monique
Purchase Details
Closed on
Jun 27, 2011
Sold by
Bank Of America Na
Bought by
Vistamont Realty Management Inc
Purchase Details
Closed on
Dec 15, 2010
Sold by
Financial Freedom Acquisition Llc
Bought by
Bank Of America Na
Purchase Details
Closed on
Sep 7, 2010
Sold by
Taylor Mamie L
Bought by
Financial Freedom Acquisition Llc
Create a Home Valuation Report for This Property
The Home Valuation Report is an in-depth analysis detailing your home's value as well as a comparison with similar homes in the area
Home Values in the Area
Average Home Value in this Area
Purchase History
| Date | Buyer | Sale Price | Title Company |
|---|---|---|---|
| Cpg Realty Management Llc | $78,000 | None Listed On Document | |
| Britton Terry Lamar | -- | None Available | |
| Vistamont Realty Management Inc | -- | None Available | |
| Bailey Shanta Monique | -- | None Available | |
| Vistamont Realty Management Inc | -- | Charter Title Company | |
| Bank Of America Na | -- | None Available | |
| Financial Freedom Acquisition Llc | $71,017 | None Available |
Source: Public Records
Mortgage History
| Date | Status | Borrower | Loan Amount |
|---|---|---|---|
| Closed | Bailey Shanta Monique | $0 |
Source: Public Records
Tax History Compared to Growth
Tax History
| Year | Tax Paid | Tax Assessment Tax Assessment Total Assessment is a certain percentage of the fair market value that is determined by local assessors to be the total taxable value of land and additions on the property. | Land | Improvement |
|---|---|---|---|---|
| 2025 | $2,587 | $123,623 | $40,706 | $82,917 |
| 2024 | $2,587 | $123,623 | $40,706 | $82,917 |
| 2023 | $2,587 | $115,469 | $30,530 | $84,939 |
| 2022 | $2,046 | $92,898 | $20,353 | $72,545 |
| 2021 | $1,769 | $75,893 | $10,177 | $65,716 |
| 2020 | $1,838 | $75,893 | $10,177 | $65,716 |
| 2019 | $1,920 | $75,893 | $10,177 | $65,716 |
| 2018 | $1,773 | $70,070 | $7,327 | $62,743 |
| 2017 | $1,772 | $70,070 | $7,327 | $62,743 |
| 2016 | $1,772 | $70,070 | $7,327 | $62,743 |
| 2015 | $1,801 | $70,070 | $7,327 | $62,743 |
| 2014 | $1,801 | $70,070 | $7,327 | $62,743 |
Source: Public Records
Map
Nearby Homes
- 8504 Shady Dr
- 9009 Compton St
- 6226 E Tidwell Rd
- 9205 & 9207 Spaulding St
- 8914 Lanewood Dr
- 5009 Tidwell Rd
- 6110 Tidwell Rd
- 6206 Antha St
- 9227 Homestead Rd
- 9317 Homestead Rd
- 6415 Laura Koppe Rd
- 9410 Dandy St
- 9603 Bertwood St
- 6513 Laura Koppe Rd
- 8928 Homestead Rd
- 6005 Laura Koppe Rd
- 9325 Grady St
- 6012 Laura Koppe Rd
- 9118 Sandra St Unit A and B
- 9711 Bertwood St
- 6302 Firnat St
- 6310 Firnat St
- 9124 Camay Dr
- 9122 Camay Dr
- 9120 Camay Dr
- 9113 Compton St
- 6307 Firnat St
- 9105 Compton St
- 9109 Compton St
- 9110 Camay Dr
- 9210 Camay Dr
- 9205 Compton St
- 9135 Camay Dr
- 9111 Camay Dr
- 0 NE Compton St Unit 18454038
- 9213 Camay Dr
- 9218 Camay Dr
- 9102 Camay Dr
- 9209 Compton St
- 9109 Camay Dr