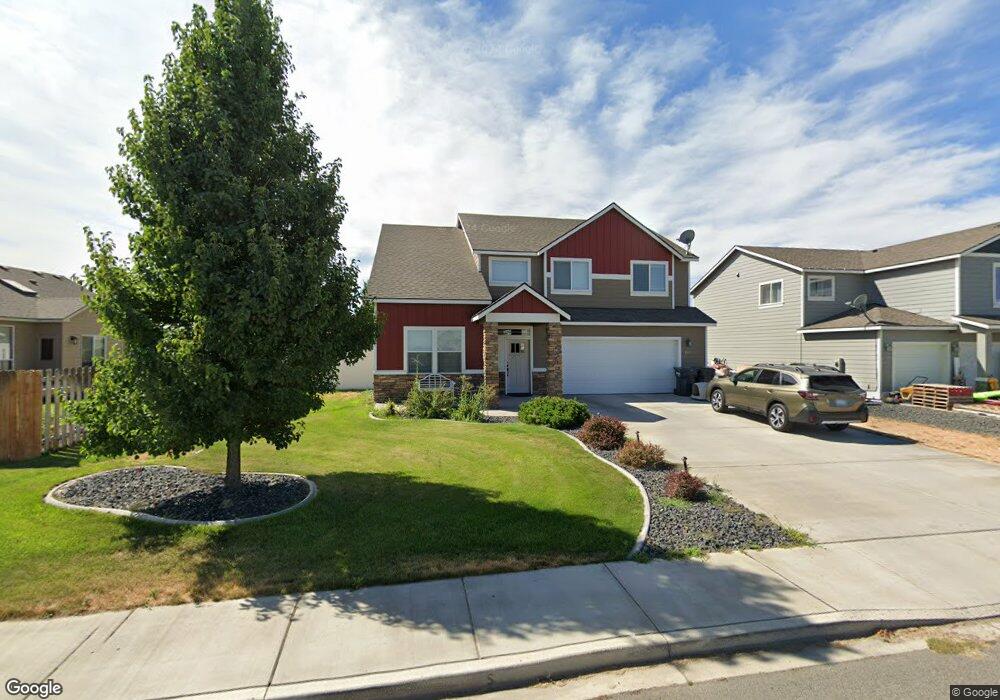
6307 Collins Rd Unit Move In Ready! West Richland, WA 99353
Estimated Value: $570,149 - $693,000
--
Bed
2
Baths
2,636
Sq Ft
$238/Sq Ft
Est. Value
About This Home
This home is located at 6307 Collins Rd Unit Move In Ready!, West Richland, WA 99353 and is currently estimated at $627,037, approximately $237 per square foot. 6307 Collins Rd Unit Move In Ready! is a home located in Benton County with nearby schools including Tapteal Elementary School and Hanford High School.
Ownership History
Date
Name
Owned For
Owner Type
Purchase Details
Closed on
Jul 8, 2014
Sold by
Nicklaus Dettrey Tina M
Bought by
Dettrey Frank J
Current Estimated Value
Home Financials for this Owner
Home Financials are based on the most recent Mortgage that was taken out on this home.
Original Mortgage
$270,200
Outstanding Balance
$205,115
Interest Rate
4.07%
Estimated Equity
$421,922
Purchase Details
Closed on
Jun 20, 2014
Sold by
Varsity Development Llc
Bought by
Dettrey Frank J
Home Financials for this Owner
Home Financials are based on the most recent Mortgage that was taken out on this home.
Original Mortgage
$270,200
Outstanding Balance
$205,115
Interest Rate
4.07%
Estimated Equity
$421,922
Purchase Details
Closed on
Feb 25, 2013
Sold by
The Falklands Inc
Bought by
Varsity Development Llc
Home Financials for this Owner
Home Financials are based on the most recent Mortgage that was taken out on this home.
Original Mortgage
$197,387
Interest Rate
3.36%
Mortgage Type
Construction
Create a Home Valuation Report for This Property
The Home Valuation Report is an in-depth analysis detailing your home's value as well as a comparison with similar homes in the area
Home Values in the Area
Average Home Value in this Area
Purchase History
| Date | Buyer | Sale Price | Title Company |
|---|---|---|---|
| Dettrey Frank J | -- | Chicago Title | |
| Dettrey Frank J | $280,000 | Chicago Title | |
| Varsity Development Llc | $44,950 | Frontier Title & Escrow Co |
Source: Public Records
Mortgage History
| Date | Status | Borrower | Loan Amount |
|---|---|---|---|
| Open | Dettrey Frank J | $270,200 | |
| Closed | Dettrey Frank J | $270,200 | |
| Previous Owner | Varsity Development Llc | $197,387 |
Source: Public Records
Tax History Compared to Growth
Tax History
| Year | Tax Paid | Tax Assessment Tax Assessment Total Assessment is a certain percentage of the fair market value that is determined by local assessors to be the total taxable value of land and additions on the property. | Land | Improvement |
|---|---|---|---|---|
| 2024 | $5,083 | $505,960 | $50,000 | $455,960 |
| 2023 | $5,083 | $478,330 | $50,000 | $428,330 |
| 2022 | $4,708 | $395,430 | $50,000 | $345,430 |
| 2021 | $4,562 | $381,610 | $50,000 | $331,610 |
| 2020 | $4,382 | $353,970 | $50,000 | $303,970 |
| 2019 | $4,026 | $326,340 | $50,000 | $276,340 |
| 2018 | $3,998 | $321,760 | $50,000 | $271,760 |
| 2017 | $3,554 | $276,470 | $50,000 | $226,470 |
| 2016 | $3,377 | $276,470 | $50,000 | $226,470 |
| 2015 | $3,373 | $276,470 | $50,000 | $226,470 |
| 2014 | -- | $271,270 | $44,800 | $226,470 |
| 2013 | -- | $271,270 | $44,800 | $226,470 |
Source: Public Records
Map
Nearby Homes
- 6631 Collins Rd
- 6370 Cobalt Dr
- 6550 Cobalt Dr
- 5120 Collins Rd
- 5900 Everett St
- 7017 Belmont Blvd Unit 23
- 6530 Meyers St Unit 103
- 6334 Hove St
- 413 Bedrock Loop
- 7103 Inca St Unit 20
- 486 Bedrock Loop
- 503 Athens Dr
- 6408 Haag St
- TBD S 58th Ave
- Lot 40 NKA Watermark Ph1
- Lot 21 NKA Watermark Ph1
- Lot 22 NKA Watermark Ph1
- 5880 S 58th Ave
- 7146 Talara Ct
- Lot 27 NKA Watermark Ph1
- 6307 Collins Rd
- 6305 Collins Rd
- 6309 Collins Rd
- 601 Panorama Ct
- 601 Panorama Ct Unit Three Possible four
- 6308 Collins Rd
- 630 Pikes Peak Dr
- 630 Pikes Peak Dr Unit Oasis home - 2012 Fu
- 603 Panorama Ct
- 6511 Westview Loop
- 650 Pikes Peak Dr
- 650 Pikes Peak Dr Unit New & Complete! TONS
- 605 Panorama Ct
- 6306 Collins Rd
- 611 Pikes Peak Dr
- 611 Pikes Peak Dr Unit 5 car garage!!! 4th
- 6303 Collins Rd
- 629 Pikes Peak Dr
- 6509 Westview Loop
- 602 Panorama Ct