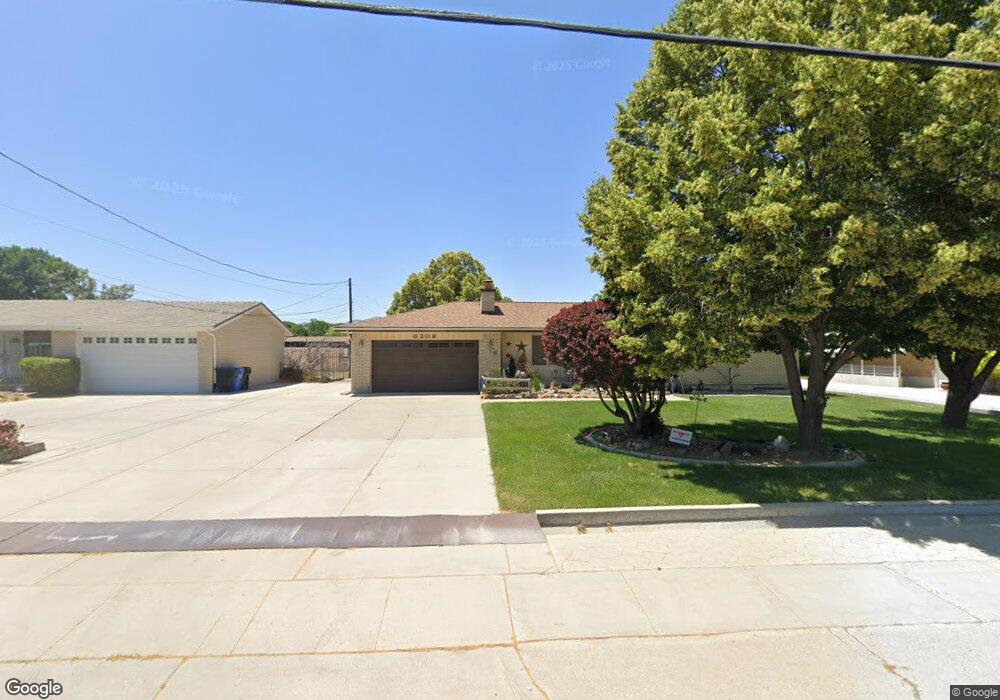
6308 S 1300 W Salt Lake City, UT 84123
Estimated Value: $589,000 - $767,017
4
Beds
3
Baths
1,364
Sq Ft
$501/Sq Ft
Est. Value
About This Home
This home is located at 6308 S 1300 W, Salt Lake City, UT 84123 and is currently estimated at $683,004, approximately $500 per square foot. 6308 S 1300 W is a home located in Salt Lake County with nearby schools including Calvin S Smith Elementary School, Bennion Junior High School, and Taylorsville High School.
Ownership History
Date
Name
Owned For
Owner Type
Purchase Details
Closed on
Aug 9, 2022
Sold by
Lisa Hunter
Bought by
Lisa Marie Hunter 2022 Trust
Current Estimated Value
Purchase Details
Closed on
Jan 2, 2006
Sold by
Miles Douglas J
Bought by
Hunter Lisa
Purchase Details
Closed on
Feb 14, 2001
Sold by
Hunter Scott E
Bought by
Hunter Scott E and Hunter Lisa M
Purchase Details
Closed on
Jan 21, 1999
Sold by
Angus Scott M and Angus Marilyn F
Bought by
Hunter Scott E
Home Financials for this Owner
Home Financials are based on the most recent Mortgage that was taken out on this home.
Original Mortgage
$162,400
Interest Rate
7.84%
Mortgage Type
Purchase Money Mortgage
Purchase Details
Closed on
Mar 3, 1994
Sold by
Beard C Janet and Janet Gordon C
Bought by
Joe Totorica Ltd Partnership
Purchase Details
Closed on
Mar 2, 1994
Sold by
Gordon Stephen L
Bought by
Joe Totorica Ltd Partnership
Create a Home Valuation Report for This Property
The Home Valuation Report is an in-depth analysis detailing your home's value as well as a comparison with similar homes in the area
Home Values in the Area
Average Home Value in this Area
Purchase History
| Date | Buyer | Sale Price | Title Company |
|---|---|---|---|
| Lisa Marie Hunter 2022 Trust | -- | None Listed On Document | |
| Hunter Lisa | $2,000 | None Available | |
| Hunter Scott E | -- | Associated Title | |
| Hunter Scott E | -- | Title West | |
| Joe Totorica Ltd Partnership | -- | -- | |
| Joe Totorica Ltd Partnership | -- | -- |
Source: Public Records
Mortgage History
| Date | Status | Borrower | Loan Amount |
|---|---|---|---|
| Previous Owner | Hunter Scott E | $162,400 |
Source: Public Records
Tax History Compared to Growth
Tax History
| Year | Tax Paid | Tax Assessment Tax Assessment Total Assessment is a certain percentage of the fair market value that is determined by local assessors to be the total taxable value of land and additions on the property. | Land | Improvement |
|---|---|---|---|---|
| 2025 | $4,098 | $699,800 | $278,400 | $421,400 |
| 2024 | $4,098 | $672,000 | $269,600 | $402,400 |
| 2023 | $3,877 | $623,700 | $251,900 | $371,800 |
| 2022 | $3,905 | $633,700 | $247,000 | $386,700 |
| 2021 | $3,421 | $483,500 | $190,000 | $293,500 |
| 2020 | $3,266 | $429,500 | $174,800 | $254,700 |
| 2019 | $3,250 | $424,500 | $174,800 | $249,700 |
| 2018 | $2,934 | $369,400 | $169,100 | $200,300 |
| 2017 | $2,643 | $349,800 | $169,100 | $180,700 |
| 2016 | $2,346 | $310,300 | $169,100 | $141,200 |
| 2015 | $2,855 | $352,800 | $172,400 | $180,400 |
| 2014 | $2,747 | $333,400 | $164,300 | $169,100 |
Source: Public Records
Map
Nearby Homes
- 1429 Connie Way
- 1471 W 6170 S
- 1506 W 6235 S
- 1481 W Bluemont Dr
- 1501 W Bluemont Dr
- 1193 W Dun Robin Ct
- 6189 S Elderberry Ln
- 6660 S Ryker Vista Ln
- 6687 Bonham Ln
- 1212 W Willow Run Dr
- 6738 Balfour Ln W
- 6773 S 1300 W
- 6891 S Columbia Dr
- 903 W Bullion St
- 913 W Bullion St Unit 10
- 6481 S 1090 W Unit 133
- 6937 S Hollow View Way
- 5834 Walden Ridge Dr
- 6683 Alice Susanna Ln
- 6483 S 1040 W