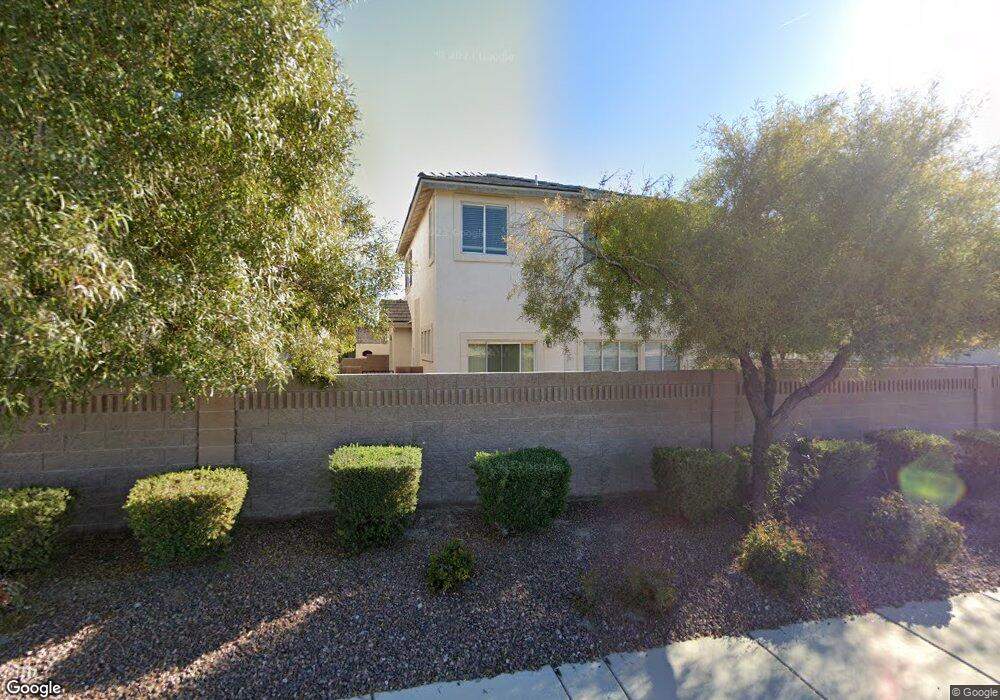
6309 Blushing Willow St North Las Vegas, NV 89081
Northridge NeighborhoodEstimated Value: $360,000 - $377,000
4
Beds
3
Baths
1,788
Sq Ft
$207/Sq Ft
Est. Value
About This Home
This home is located at 6309 Blushing Willow St, North Las Vegas, NV 89081 and is currently estimated at $370,498, approximately $207 per square foot. 6309 Blushing Willow St is a home located in Clark County with nearby schools including Don E. Hayden Elementary School, Ruby Duncan Elementary School, and Carroll M. Johnston STEM Academy of Environmental Studies.
Ownership History
Date
Name
Owned For
Owner Type
Purchase Details
Closed on
Dec 14, 2021
Sold by
Tarlton Las Vegas Llc
Bought by
Sfr Jv 2 Property Llc
Current Estimated Value
Purchase Details
Closed on
May 26, 2011
Sold by
Tarlton Properties Llc
Bought by
Tarlton Las Vegas Llc
Purchase Details
Closed on
Oct 8, 2009
Sold by
Nationstar Mortgage Llc
Bought by
Tarlton Properties Llc
Purchase Details
Closed on
Jun 12, 2009
Sold by
Zepeda Oswaldo S and Zepeda Thelma A
Bought by
Nationstar Mortgage Llc
Purchase Details
Closed on
Jan 16, 2007
Sold by
William Lyon Homes Inc
Bought by
Zepeda Oswaldo S and Zepeda Thelma A
Home Financials for this Owner
Home Financials are based on the most recent Mortgage that was taken out on this home.
Original Mortgage
$172,550
Interest Rate
6.09%
Mortgage Type
Balloon
Create a Home Valuation Report for This Property
The Home Valuation Report is an in-depth analysis detailing your home's value as well as a comparison with similar homes in the area
Home Values in the Area
Average Home Value in this Area
Purchase History
| Date | Buyer | Sale Price | Title Company |
|---|---|---|---|
| Sfr Jv 2 Property Llc | $341,000 | Os National Las Vegas | |
| Tarlton Las Vegas Llc | $87,500 | None Available | |
| Tarlton Properties Llc | $87,500 | Equity Title Of Nevada | |
| Nationstar Mortgage Llc | $145,174 | None Available | |
| Zepeda Oswaldo S | $265,515 | Fidelity National Title |
Source: Public Records
Mortgage History
| Date | Status | Borrower | Loan Amount |
|---|---|---|---|
| Previous Owner | Zepeda Oswaldo S | $172,550 |
Source: Public Records
Tax History Compared to Growth
Tax History
| Year | Tax Paid | Tax Assessment Tax Assessment Total Assessment is a certain percentage of the fair market value that is determined by local assessors to be the total taxable value of land and additions on the property. | Land | Improvement |
|---|---|---|---|---|
| 2025 | $1,743 | $106,808 | $29,400 | $77,408 |
| 2024 | $1,615 | $106,808 | $29,400 | $77,408 |
| 2023 | $1,615 | $99,601 | $26,950 | $72,651 |
| 2022 | $1,496 | $88,388 | $22,050 | $66,338 |
| 2021 | $1,385 | $82,790 | $19,950 | $62,840 |
| 2020 | $1,283 | $82,130 | $19,950 | $62,180 |
| 2019 | $1,203 | $77,514 | $16,450 | $61,064 |
| 2018 | $1,148 | $66,873 | $12,600 | $54,273 |
| 2017 | $1,956 | $58,318 | $11,200 | $47,118 |
| 2016 | $1,085 | $48,800 | $8,750 | $40,050 |
| 2015 | $1,082 | $44,900 | $6,650 | $38,250 |
| 2014 | $1,049 | $30,330 | $4,550 | $25,780 |
Source: Public Records
Map
Nearby Homes
- 1023 Sunny Acres Ave
- 1231 Appaloosa Hills Ave
- 1156 Appaloosa Hills Ave
- 6242 Standing Elm St
- 909 Nevada Blaze Ave
- 6446 Silver Estates St
- 6243 Black Mane Way
- 6425 Sierra Sands St
- 6472 Centennial Skies Ct
- 1008 Oceanwood Ave
- 6032 Draft Horse Dr
- 1409 Palomino Farm Way
- 760 Crisp Morning Ct
- 6338 Black Mane Way
- 6020 Old Vines St
- 6009 Arbor Crest St
- 329 Gemstone Hill Ave
- 6249 Disruptor St Unit 2
- 6229 Disruptor St Unit 2
- Paxton Plan at Heritage Square
- 6311 Blushing Willow St Unit 2
- 6307 Blushing Willow St Unit 2
- 6305 Blushing Willow St
- 6313 Blushing Willow St
- 6247 Blushing Willow St
- 6315 Blushing Willow St
- 6245 Blushing Willow St
- 6251 Blushing Willow St
- 6317 Blushing Willow St
- 6325 Blushing Willow St
- 6243 Blushing Willow St
- 6323 Blushing Willow St
- 6323 Blushing Willow St Unit 2
- 6323 Blushing Willow St
- 6237 Blushing Willow St
- 6237 Blushing Willow St
- 6327 Blushing Willow St Unit 4
- 6321 Blushing Willow St
- 922 Sunny Acres Ave