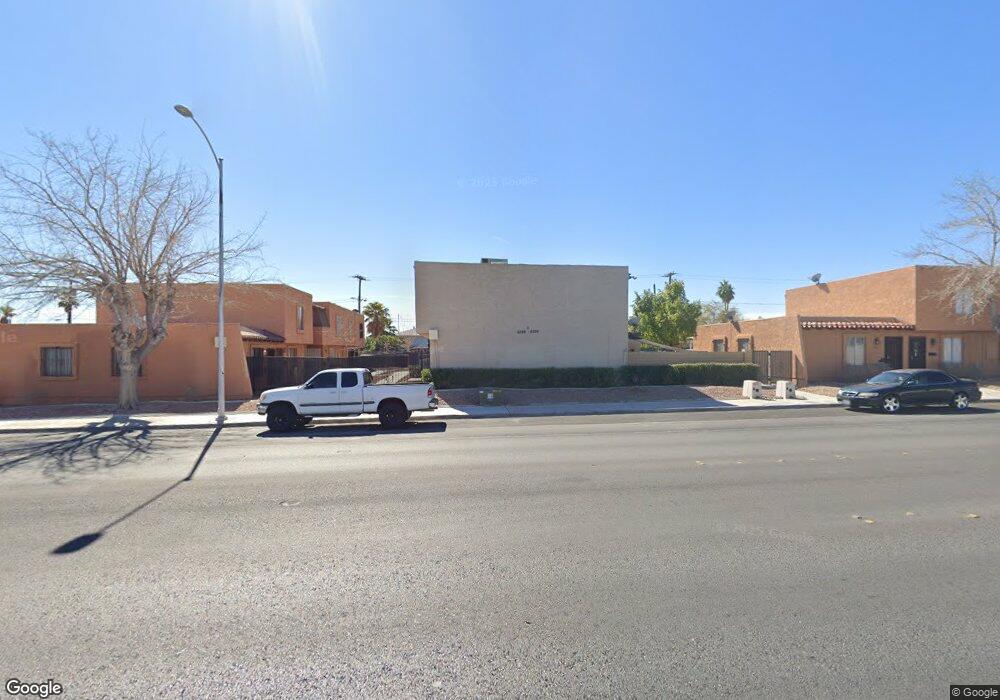
6309 W Washington Ave Las Vegas, NV 89107
Pittman NeighborhoodEstimated Value: $226,000 - $254,000
3
Beds
2
Baths
1,254
Sq Ft
$191/Sq Ft
Est. Value
About This Home
This home is located at 6309 W Washington Ave, Las Vegas, NV 89107 and is currently estimated at $239,310, approximately $190 per square foot. 6309 W Washington Ave is a home located in Clark County with nearby schools including Vail Pittman Elementary School, Frank F Garside Junior High School, and Western High School.
Ownership History
Date
Name
Owned For
Owner Type
Purchase Details
Closed on
May 30, 2006
Sold by
Le Clair Lisa
Bought by
Le Clair Lisa A
Current Estimated Value
Home Financials for this Owner
Home Financials are based on the most recent Mortgage that was taken out on this home.
Original Mortgage
$106,500
Outstanding Balance
$62,438
Interest Rate
6.52%
Mortgage Type
Fannie Mae Freddie Mac
Estimated Equity
$176,872
Purchase Details
Closed on
Jan 26, 2000
Sold by
Leclair Lisa and Leclair Lisa A
Bought by
Leclair Lisa
Home Financials for this Owner
Home Financials are based on the most recent Mortgage that was taken out on this home.
Original Mortgage
$25,000
Interest Rate
7.87%
Purchase Details
Closed on
May 28, 1997
Sold by
Becker Barry W and Becker Susan D
Bought by
Leclair Lisa A
Home Financials for this Owner
Home Financials are based on the most recent Mortgage that was taken out on this home.
Original Mortgage
$63,500
Interest Rate
8.13%
Create a Home Valuation Report for This Property
The Home Valuation Report is an in-depth analysis detailing your home's value as well as a comparison with similar homes in the area
Home Values in the Area
Average Home Value in this Area
Purchase History
| Date | Buyer | Sale Price | Title Company |
|---|---|---|---|
| Le Clair Lisa A | -- | Southwest Title | |
| Leclair Lisa | -- | Lawyers Title | |
| Leclair Lisa A | $65,500 | Land Title |
Source: Public Records
Mortgage History
| Date | Status | Borrower | Loan Amount |
|---|---|---|---|
| Open | Le Clair Lisa A | $106,500 | |
| Closed | Leclair Lisa | $25,000 | |
| Closed | Leclair Lisa A | $63,500 |
Source: Public Records
Tax History Compared to Growth
Tax History
| Year | Tax Paid | Tax Assessment Tax Assessment Total Assessment is a certain percentage of the fair market value that is determined by local assessors to be the total taxable value of land and additions on the property. | Land | Improvement |
|---|---|---|---|---|
| 2025 | $585 | $35,496 | $19,250 | $16,246 |
| 2024 | $542 | $35,496 | $19,250 | $16,246 |
| 2023 | $542 | $30,574 | $16,450 | $14,124 |
| 2022 | $502 | $26,504 | $12,600 | $13,904 |
| 2021 | $465 | $23,183 | $11,550 | $11,633 |
| 2020 | $429 | $23,049 | $10,500 | $12,549 |
| 2019 | $402 | $21,547 | $8,750 | $12,797 |
| 2018 | $384 | $18,845 | $6,300 | $12,545 |
| 2017 | $583 | $16,704 | $4,900 | $11,804 |
| 2016 | $361 | $17,151 | $4,550 | $12,601 |
| 2015 | $359 | $14,658 | $3,150 | $11,508 |
| 2014 | $347 | $9,130 | $2,100 | $7,030 |
Source: Public Records
Map
Nearby Homes
- 6325 W Washington Ave
- 6224 Fargo Ave
- 6244 Rassler Ave
- 6261 Rassler Ave
- 6229 Saginaw Dr
- 704 N Wallace Dr
- 6205 Carmen Blvd
- 304 N Torrey Pines Dr
- 6121 Fawn Cir
- 6100 Fawn Cir
- 1209 Coral Isle Way
- 812 Pepperwood Ln
- 6112 Denver Cir
- 814 Pepperwood Ln
- 5924 Iris Ave
- 6521 Sugarpine Ln
- 6509 Brushwood Ln
- 1116 N Jones Blvd
- 6505 Hill View Ave
- 6532 Moon Roses Ct
- 6307 W Washington Ave
- 6305 W Washington Ave
- 6303 W Washington Ave
- 6313 W Washington Ave
- 6301 W Washington Ave
- 6287 W Washington Ave
- 6289 W Washington Ave
- 6315 W Washington Ave
- 6291 W Washington Ave
- 6293 W Washington Ave
- 6317 W Washington Ave
- 6295 W Washington Ave
- 6297 W Washington Ave
- 6285 W Washington Ave
- 6283 W Washington Ave
- 6319 W Washington Ave
- 6323 W Washington Ave
- 6321 W Washington Ave
- 6301 Greyhawk Ave
- 6327 W Washington Ave