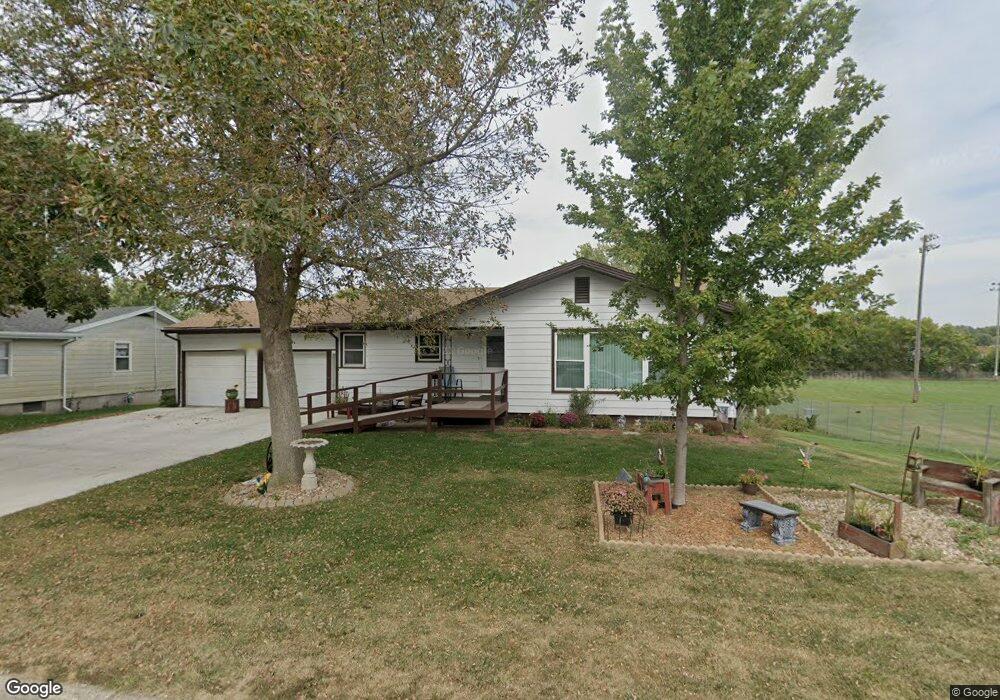
631 9th St Manning, IA 51455
Estimated Value: $136,000 - $193,000
2
Beds
3
Baths
1,120
Sq Ft
$142/Sq Ft
Est. Value
About This Home
This home is located at 631 9th St, Manning, IA 51455 and is currently estimated at $158,896, approximately $141 per square foot. 631 9th St is a home with nearby schools including Ikm-Manning High School, IKM-Manning Middle School, and Irwin Elementary School.
Ownership History
Date
Name
Owned For
Owner Type
Purchase Details
Closed on
May 1, 2007
Sold by
Hagedorn Larry A and Hagedorn Elizabeth
Bought by
Rowedder Timothy J and Rowedder Brenda K
Current Estimated Value
Home Financials for this Owner
Home Financials are based on the most recent Mortgage that was taken out on this home.
Original Mortgage
$17,975
Outstanding Balance
$10,856
Interest Rate
6.22%
Mortgage Type
Unknown
Estimated Equity
$148,040
Create a Home Valuation Report for This Property
The Home Valuation Report is an in-depth analysis detailing your home's value as well as a comparison with similar homes in the area
Purchase History
| Date | Buyer | Sale Price | Title Company |
|---|---|---|---|
| Rowedder Timothy J | $58,000 | None Available |
Source: Public Records
Mortgage History
| Date | Status | Borrower | Loan Amount |
|---|---|---|---|
| Open | Rowedder Timothy J | $17,975 | |
| Open | Rowedder Timothy J | $45,167 |
Source: Public Records
Tax History
| Year | Tax Paid | Tax Assessment Tax Assessment Total Assessment is a certain percentage of the fair market value that is determined by local assessors to be the total taxable value of land and additions on the property. | Land | Improvement |
|---|---|---|---|---|
| 2025 | $1,842 | $149,330 | $16,230 | $133,100 |
| 2024 | $18 | $125,200 | $16,230 | $108,970 |
| 2023 | $1,734 | $125,200 | $16,230 | $108,970 |
| 2022 | $1,710 | $103,950 | $14,060 | $89,890 |
| 2021 | $1,710 | $103,950 | $14,060 | $89,890 |
| 2020 | $1,740 | $103,950 | $14,060 | $89,890 |
| 2019 | $1,648 | $103,950 | $14,060 | $89,890 |
| 2018 | $1,576 | $103,950 | $14,060 | $89,890 |
| 2017 | $1,576 | $94,984 | $11,032 | $83,952 |
| 2016 | $1,474 | $88,770 | $0 | $0 |
| 2015 | $1,474 | $82,480 | $0 | $0 |
| 2014 | $1,378 | $82,480 | $0 | $0 |
Source: Public Records
Map
Nearby Homes
Your Personal Tour Guide
Ask me questions while you tour the home.