Estimated Value: $190,000 - $262,000
3
Beds
2
Baths
1,708
Sq Ft
$132/Sq Ft
Est. Value
About This Home
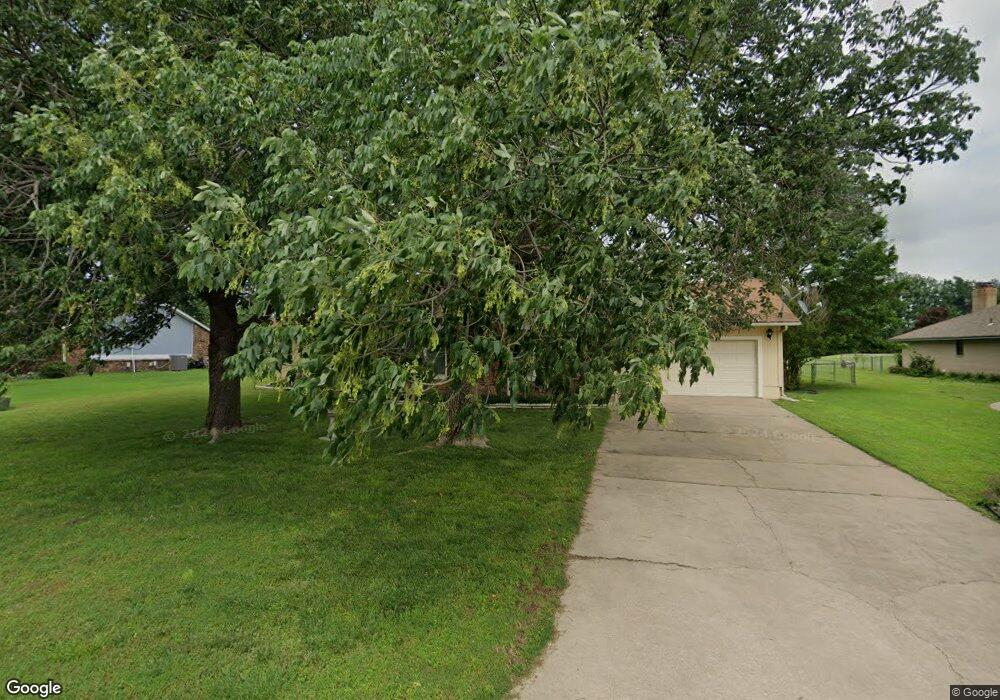
This home is located at 631 Alpine Dr, Grove, OK 74344 and is currently estimated at $225,574, approximately $132 per square foot. 631 Alpine Dr is a home located in Delaware County with nearby schools including Grove Lower Elementary School, Grove Upper Elementary School, and Grove Middle School.
Ownership History
Date
Name
Owned For
Owner Type
Purchase Details
Closed on
Mar 15, 2008
Sold by
Wentworth Marc and Wentworth Glenda
Bought by
Gain Christopher J and Gain Amanda M
Current Estimated Value
Home Financials for this Owner
Home Financials are based on the most recent Mortgage that was taken out on this home.
Original Mortgage
$129,500
Outstanding Balance
$81,898
Interest Rate
6.11%
Mortgage Type
New Conventional
Estimated Equity
$143,676
Purchase Details
Closed on
Mar 14, 2008
Sold by
Locke Konnie and Locke Tom
Bought by
Gain Christopher J and Gain Amanda M
Home Financials for this Owner
Home Financials are based on the most recent Mortgage that was taken out on this home.
Original Mortgage
$129,500
Outstanding Balance
$81,898
Interest Rate
6.11%
Mortgage Type
New Conventional
Estimated Equity
$143,676
Purchase Details
Closed on
Feb 2, 2000
Sold by
Powell Samuel R
Create a Home Valuation Report for This Property
The Home Valuation Report is an in-depth analysis detailing your home's value as well as a comparison with similar homes in the area
Home Values in the Area
Average Home Value in this Area
Purchase History
We collect this data history from publicly available records. To have your information removed, we recommend requesting removal directly through your county’s website.
| Date | Buyer | Sale Price | Title Company |
|---|---|---|---|
| Gain Christopher J | $124,000 | -- | |
| Gain Christopher J | -- | -- | |
| -- | $93,000 | -- |
Source: Public Records
Mortgage History
We collect this data history from publicly available records. To have your information removed, we recommend requesting removal directly through your county’s website.
| Date | Status | Borrower | Loan Amount |
|---|---|---|---|
| Open | Gain Christopher J | $129,500 |
Source: Public Records
Tax History
| Year | Tax Paid | Tax Assessment Tax Assessment Total Assessment is a certain percentage of the fair market value that is determined by local assessors to be the total taxable value of land and additions on the property. | Land | Improvement |
|---|---|---|---|---|
| 2025 | $1,061 | $14,110 | $1,558 | $12,552 |
| 2024 | $1,028 | $13,699 | $1,513 | $12,186 |
| 2023 | $1,028 | $13,300 | $1,452 | $11,848 |
| 2022 | $995 | $13,300 | $1,438 | $11,862 |
| 2021 | $3,311 | $12,537 | $1,438 | $11,099 |
| 2020 | $991 | $12,697 | $1,438 | $11,259 |
| 2019 | $965 | $12,353 | $1,438 | $10,915 |
| 2018 | $960 | $12,307 | $1,438 | $10,869 |
| 2017 | $954 | $12,401 | $1,438 | $10,963 |
| 2016 | $923 | $11,846 | $1,438 | $10,408 |
| 2015 | $1,092 | $12,651 | $1,323 | $11,328 |
| 2014 | $1,097 | $12,651 | $1,323 | $11,328 |
Source: Public Records
Map
Nearby Homes
- 1407 W 11th St
- 1003 Quail Run Rd
- 1019 Village Dr
- 2850 Harber Oaks Loop
- 511 Summit Dr
- 0 Run
- 0 Rd Unit 26-1190
- 1419 Bay Shore Dr
- 2711 Lookout Ln
- TBD Baycrest Ave
- 2300 Lookout Ln
- 212 Peach Cir
- 1504 Carey Dr
- 1513 Carey Dr
- 2607 Shasten St
- 1305 Dubois
- 2666 Shasten St
- 2668 Shasten St
- 59488 E 301 Rd
- 1616 Battle Dr
Your Personal Tour Guide
Ask me questions while you tour the home.