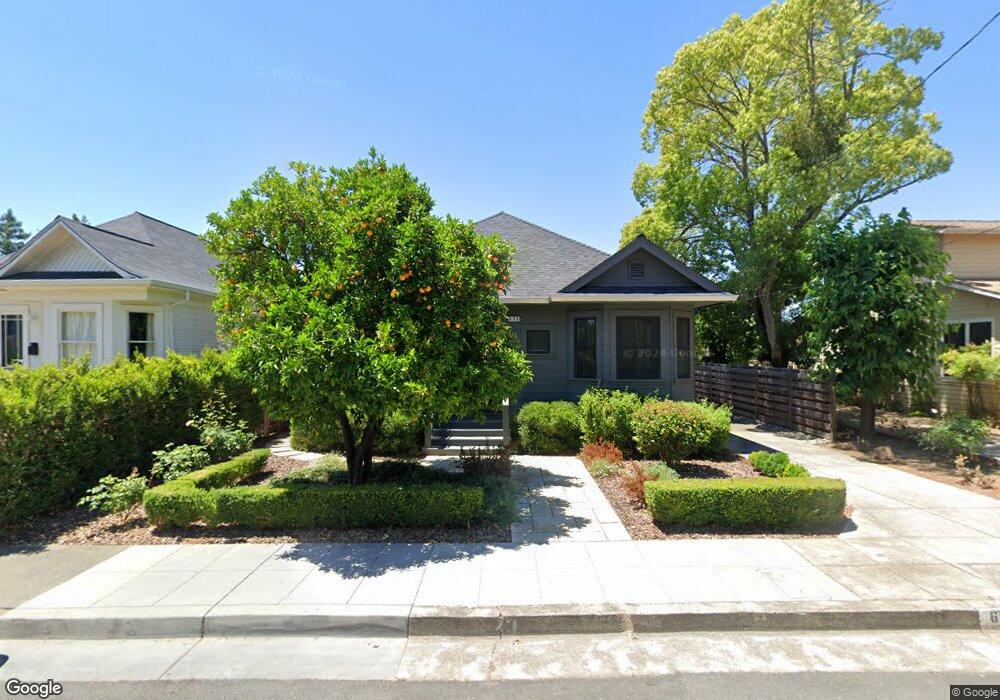
631 Brown St Healdsburg, CA 95448
Estimated Value: $1,606,000 - $3,129,000
2
Beds
1
Bath
1,153
Sq Ft
$2,248/Sq Ft
Est. Value
About This Home
This home is located at 631 Brown St, Healdsburg, CA 95448 and is currently estimated at $2,592,000, approximately $2,248 per square foot. 631 Brown St is a home located in Sonoma County with nearby schools including Healdsburg Elementary School, Healdsburg Junior High School, and Healdsburg High School.
Ownership History
Date
Name
Owned For
Owner Type
Purchase Details
Closed on
Dec 14, 2016
Sold by
Butcher Ian and Butcher Elizabeth Dundee
Bought by
Butcher Ian George and Butcher Elizabeth Dundee
Current Estimated Value
Purchase Details
Closed on
Aug 10, 2016
Sold by
Derenzo Ronald J and Derenzo Patricia A
Bought by
Butcher Ian and Butcher Elizabeth Dundee
Purchase Details
Closed on
Mar 12, 1998
Sold by
Derenzo Ronald J and Derenzo Joan Marie A
Bought by
Derenzo Ronald J and Derenzo Patricia A
Create a Home Valuation Report for This Property
The Home Valuation Report is an in-depth analysis detailing your home's value as well as a comparison with similar homes in the area
Home Values in the Area
Average Home Value in this Area
Purchase History
| Date | Buyer | Sale Price | Title Company |
|---|---|---|---|
| Butcher Ian George | -- | None Available | |
| Butcher Ian | $770,000 | Fidelity National Title Co | |
| Derenzo Ronald J | -- | First American Title Company |
Source: Public Records
Tax History
| Year | Tax Paid | Tax Assessment Tax Assessment Total Assessment is a certain percentage of the fair market value that is determined by local assessors to be the total taxable value of land and additions on the property. | Land | Improvement |
|---|---|---|---|---|
| 2025 | $28,500 | $2,454,137 | $981,654 | $1,472,483 |
| 2024 | $27,559 | $2,406,017 | $962,406 | $1,443,611 |
| 2023 | $27,559 | $2,358,841 | $943,536 | $1,415,305 |
| 2022 | $26,813 | $2,312,590 | $925,036 | $1,387,554 |
| 2021 | $26,560 | $2,267,247 | $906,899 | $1,360,348 |
| 2020 | $17,744 | $2,244,000 | $897,600 | $1,346,400 |
| 2019 | $25,731 | $2,200,000 | $880,000 | $1,320,000 |
| 2018 | $6,059 | $503,900 | $428,400 | $75,500 |
| 2017 | $9,112 | $770,000 | $420,000 | $350,000 |
| 2016 | $549 | $33,411 | $12,414 | $20,997 |
| 2015 | $540 | $32,910 | $12,228 | $20,682 |
| 2014 | $538 | $32,266 | $11,989 | $20,277 |
Source: Public Records
Map
Nearby Homes
Your Personal Tour Guide
Ask me questions while you tour the home.