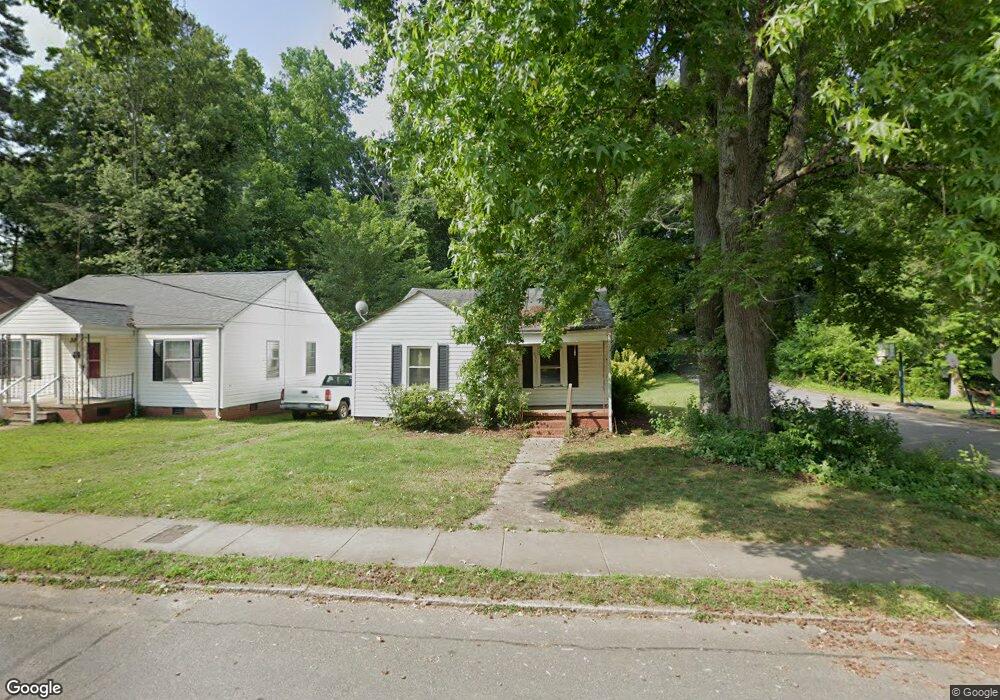
631 Elm St Salisbury, NC 28144
Estimated Value: $124,763 - $174,000
--
Bed
1
Bath
792
Sq Ft
$191/Sq Ft
Est. Value
About This Home
This home is located at 631 Elm St, Salisbury, NC 28144 and is currently estimated at $150,941, approximately $190 per square foot. 631 Elm St is a home located in Rowan County with nearby schools including Elizabeth Duncan Koontz Elementary School, Knox Middle School, and North Rowan Middle School.
Ownership History
Date
Name
Owned For
Owner Type
Purchase Details
Closed on
Dec 13, 2021
Sold by
Crayton Benny Michael and Crayton Ann Alexander
Bought by
Denison Investment Properties Llc
Current Estimated Value
Home Financials for this Owner
Home Financials are based on the most recent Mortgage that was taken out on this home.
Original Mortgage
$27,500
Outstanding Balance
$21,505
Interest Rate
2.35%
Mortgage Type
Purchase Money Mortgage
Estimated Equity
$129,436
Purchase Details
Closed on
Jan 24, 1997
Bought by
Crayton Benny Michael
Create a Home Valuation Report for This Property
The Home Valuation Report is an in-depth analysis detailing your home's value as well as a comparison with similar homes in the area
Home Values in the Area
Average Home Value in this Area
Purchase History
| Date | Buyer | Sale Price | Title Company |
|---|---|---|---|
| Denison Investment Properties Llc | $27,500 | None Available | |
| Crayton Benny Michael | -- | -- |
Source: Public Records
Mortgage History
| Date | Status | Borrower | Loan Amount |
|---|---|---|---|
| Open | Denison Investment Properties Llc | $27,500 |
Source: Public Records
Tax History Compared to Growth
Tax History
| Year | Tax Paid | Tax Assessment Tax Assessment Total Assessment is a certain percentage of the fair market value that is determined by local assessors to be the total taxable value of land and additions on the property. | Land | Improvement |
|---|---|---|---|---|
| 2025 | $800 | $66,903 | $15,994 | $50,909 |
| 2024 | $800 | $66,903 | $15,994 | $50,909 |
| 2023 | $800 | $66,903 | $15,994 | $50,909 |
| 2022 | $601 | $43,656 | $13,171 | $30,485 |
| 2021 | $601 | $43,656 | $13,171 | $30,485 |
| 2020 | $601 | $43,656 | $13,171 | $30,485 |
| 2019 | $601 | $43,656 | $13,171 | $30,485 |
| 2018 | $515 | $37,922 | $13,171 | $24,751 |
| 2017 | $513 | $37,922 | $13,171 | $24,751 |
| 2016 | $498 | $37,922 | $13,171 | $24,751 |
| 2015 | $502 | $37,922 | $13,171 | $24,751 |
| 2014 | $509 | $38,960 | $13,171 | $25,789 |
Source: Public Records
Map
Nearby Homes