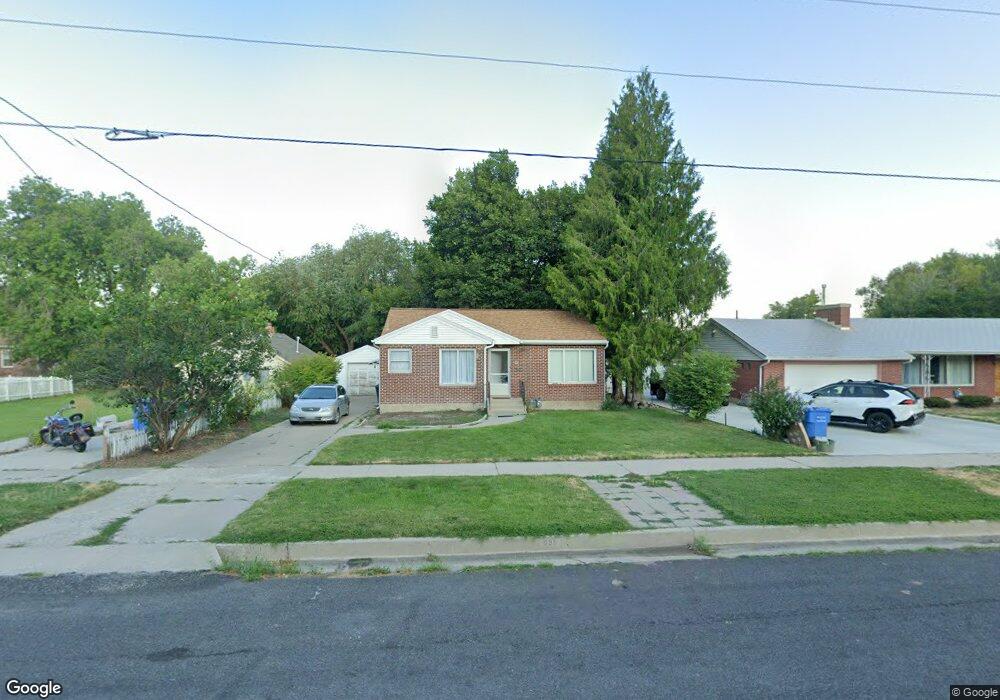
631 N 300 E Logan, UT 84321
Adams NeighborhoodEstimated Value: $327,000 - $382,000
Studio
--
Bath
810
Sq Ft
$435/Sq Ft
Est. Value
About This Home
This home is located at 631 N 300 E, Logan, UT 84321 and is currently estimated at $352,174, approximately $434 per square foot. 631 N 300 E is a home with nearby schools including Adams Elementary School, Mount Logan Middle School, and Logan High School.
Ownership History
Date
Name
Owned For
Owner Type
Purchase Details
Closed on
Aug 21, 2024
Sold by
Hymas Terry
Bought by
Munford Dakota Andrew and Butterfield Adrian Rae
Current Estimated Value
Home Financials for this Owner
Home Financials are based on the most recent Mortgage that was taken out on this home.
Original Mortgage
$320,000
Outstanding Balance
$315,708
Interest Rate
6.38%
Mortgage Type
New Conventional
Estimated Equity
$36,466
Purchase Details
Closed on
May 21, 2009
Sold by
Hymas Terry
Bought by
Hymas Terry and Hymas Ruth A
Create a Home Valuation Report for This Property
The Home Valuation Report is an in-depth analysis detailing your home's value as well as a comparison with similar homes in the area
Home Values in the Area
Average Home Value in this Area
Purchase History
| Date | Buyer | Sale Price | Title Company |
|---|---|---|---|
| Munford Dakota Andrew | -- | Lincoln Title | |
| Hymas Terry | -- | Hickman Land Title Company |
Source: Public Records
Mortgage History
| Date | Status | Borrower | Loan Amount |
|---|---|---|---|
| Open | Munford Dakota Andrew | $320,000 |
Source: Public Records
Tax History
| Year | Tax Paid | Tax Assessment Tax Assessment Total Assessment is a certain percentage of the fair market value that is determined by local assessors to be the total taxable value of land and additions on the property. | Land | Improvement |
|---|---|---|---|---|
| 2025 | $1,502 | $194,215 | $0 | $0 |
| 2024 | $1,550 | $194,215 | $0 | $0 |
| 2023 | $1,618 | $193,225 | $0 | $0 |
| 2022 | $1,733 | $193,225 | $0 | $0 |
| 2021 | $1,385 | $238,570 | $45,000 | $193,570 |
| 2020 | $1,251 | $193,900 | $45,000 | $148,900 |
| 2019 | $1,307 | $193,900 | $45,000 | $148,900 |
| 2018 | $1,120 | $151,736 | $45,000 | $106,736 |
| 2017 | $1,078 | $77,165 | $0 | $0 |
| 2016 | $1,117 | $72,765 | $0 | $0 |
| 2015 | $1,055 | $72,765 | $0 | $0 |
| 2014 | $954 | $72,765 | $0 | $0 |
| 2013 | -- | $72,365 | $0 | $0 |
Source: Public Records
Map
Nearby Homes
Your Personal Tour Guide
Ask me questions while you tour the home.