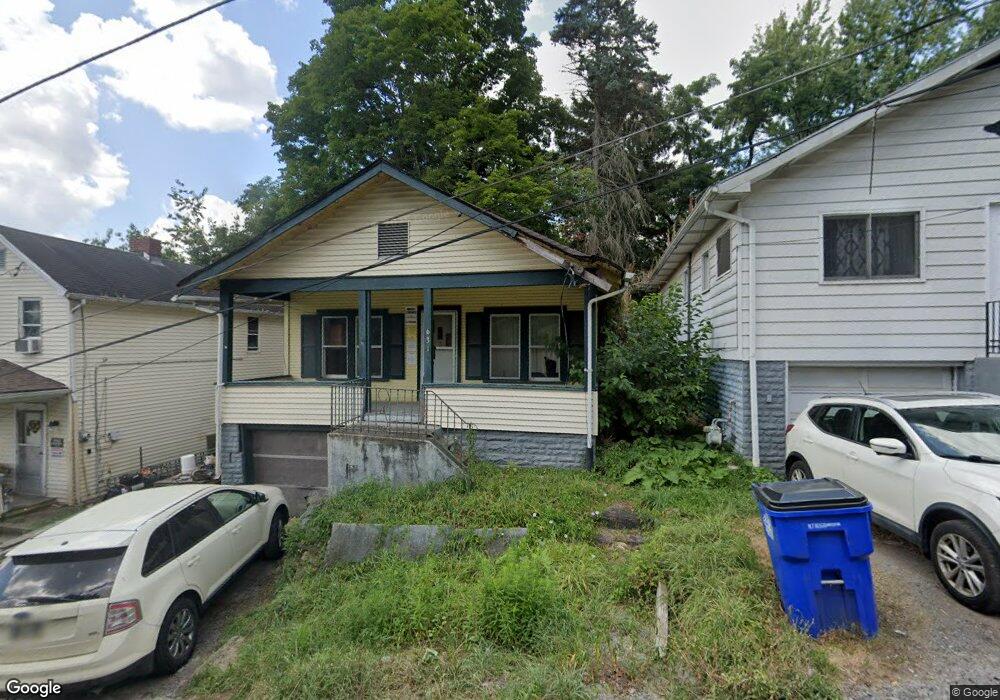
631 Riley Ave East Liverpool, OH 43920
Estimated Value: $26,000 - $64,000
2
Beds
1
Bath
768
Sq Ft
$61/Sq Ft
Est. Value
About This Home
This home is located at 631 Riley Ave, East Liverpool, OH 43920 and is currently estimated at $47,048, approximately $61 per square foot. 631 Riley Ave is a home located in Columbiana County with nearby schools including Westgate Middle School, North Elementary School, and East Liverpool High School.
Ownership History
Date
Name
Owned For
Owner Type
Purchase Details
Closed on
Apr 17, 2006
Sold by
631 Riley Land Trust
Bought by
Meiser Justin S
Current Estimated Value
Home Financials for this Owner
Home Financials are based on the most recent Mortgage that was taken out on this home.
Original Mortgage
$40,375
Outstanding Balance
$23,175
Interest Rate
6.34%
Mortgage Type
Stand Alone First
Estimated Equity
$23,873
Purchase Details
Closed on
Mar 27, 2004
Sold by
Ferguson Kenneth D and Ferguson Sheila A
Bought by
631 Riley Land Trust
Purchase Details
Closed on
Jan 10, 2003
Sold by
Est Thomas J Sullivan
Bought by
Ferguson Kenneth D
Purchase Details
Closed on
Dec 30, 2002
Sold by
Moore Thomas H and Estate Of Thomas J Sullivan
Bought by
Ferguson Kenneth Dean
Purchase Details
Closed on
Nov 15, 2002
Sold by
Estate Of Betty Marie Sullivan
Bought by
Sullivan Thomas J
Create a Home Valuation Report for This Property
The Home Valuation Report is an in-depth analysis detailing your home's value as well as a comparison with similar homes in the area
Home Values in the Area
Average Home Value in this Area
Purchase History
| Date | Buyer | Sale Price | Title Company |
|---|---|---|---|
| Meiser Justin S | $42,500 | Heritage Title Insurance Age | |
| 631 Riley Land Trust | -- | -- | |
| Ferguson Kenneth D | $10,000 | -- | |
| Ferguson Kenneth Dean | $10,000 | -- | |
| Sullivan Thomas J | -- | -- |
Source: Public Records
Mortgage History
| Date | Status | Borrower | Loan Amount |
|---|---|---|---|
| Open | Meiser Justin S | $40,375 |
Source: Public Records
Tax History Compared to Growth
Tax History
| Year | Tax Paid | Tax Assessment Tax Assessment Total Assessment is a certain percentage of the fair market value that is determined by local assessors to be the total taxable value of land and additions on the property. | Land | Improvement |
|---|---|---|---|---|
| 2024 | $339 | $5,780 | $420 | $5,360 |
| 2023 | $339 | $5,780 | $420 | $5,360 |
| 2022 | $339 | $5,780 | $420 | $5,360 |
| 2021 | $308 | $4,660 | $390 | $4,270 |
| 2020 | $308 | $4,660 | $390 | $4,270 |
| 2019 | $246 | $4,660 | $390 | $4,270 |
| 2018 | $544 | $4,240 | $350 | $3,890 |
| 2017 | $219 | $4,240 | $350 | $3,890 |
| 2016 | $226 | $3,890 | $350 | $3,540 |
| 2015 | $196 | $3,890 | $350 | $3,540 |
| 2014 | $223 | $3,890 | $350 | $3,540 |
Source: Public Records
Map
Nearby Homes
- 633 Riley Ave
- 629 Riley Ave
- 641 Riley Ave
- 627 Riley Ave
- 643 Riley Ave
- 625 Riley Ave
- 644 Riley Ave
- 645 Riley Ave
- 647 Riley Ave
- 621 Riley Ave
- 648 Riley Ave
- 653 Riley Ave
- 716 Minerva St
- 803 Bradshaw Ave Unit 624
- 720 Minerva St
- 714 Minerva St
- 809 Bradshaw (Rear) Ave
- 735 Bradshaw Ave
- 809 Bradshaw Ave
- 809 Bradshaw Ave