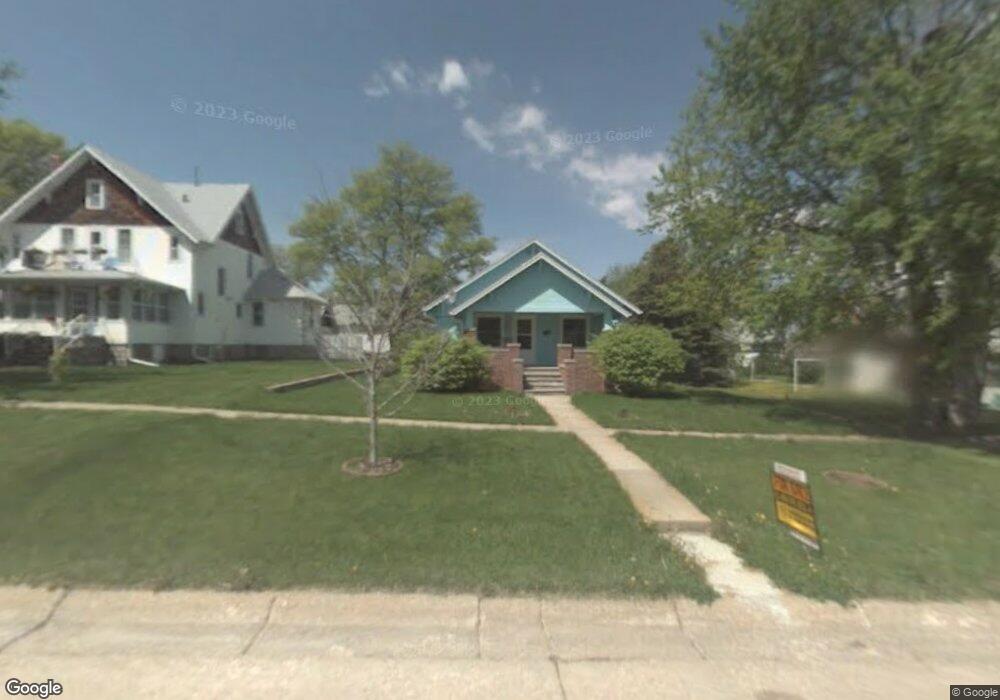
631 S 12th Ave Broken Bow, NE 68822
Estimated Value: $90,000 - $113,000
Studio
1
Bath
984
Sq Ft
$104/Sq Ft
Est. Value
About This Home
This home is located at 631 S 12th Ave, Broken Bow, NE 68822 and is currently estimated at $101,936, approximately $103 per square foot. 631 S 12th Ave is a home located in Custer County with nearby schools including North Park Elementary School, Broken Bow Junior High School, and Broken Bow High School.
Ownership History
Date
Name
Owned For
Owner Type
Purchase Details
Closed on
Mar 27, 2017
Sold by
Burnett Jeffrey W and Burnett Lana J
Bought by
Dodd Monte D and Dodd Lera Lorraine
Current Estimated Value
Purchase Details
Closed on
Apr 5, 2013
Sold by
Olson Spencer J Etal
Bought by
Burnett Jeffrey W and Burnett Lana J
Purchase Details
Closed on
Jun 14, 2010
Sold by
Reiser Bonnie B
Bought by
Olson Spencer J
Purchase Details
Closed on
Apr 2, 2008
Sold by
Appleton Lorraine
Bought by
Reiser Bonnie B
Create a Home Valuation Report for This Property
The Home Valuation Report is an in-depth analysis detailing your home's value as well as a comparison with similar homes in the area
Home Values in the Area
Average Home Value in this Area
Purchase History
| Date | Buyer | Sale Price | Title Company |
|---|---|---|---|
| Dodd Monte D | $95,000 | -- | |
| Burnett Jeffrey W | $84,500 | -- | |
| Olson Spencer J | $57,000 | -- | |
| Reiser Bonnie B | $49,900 | -- |
Source: Public Records
Tax History
| Year | Tax Paid | Tax Assessment Tax Assessment Total Assessment is a certain percentage of the fair market value that is determined by local assessors to be the total taxable value of land and additions on the property. | Land | Improvement |
|---|---|---|---|---|
| 2025 | $217 | $107,591 | $6,160 | $101,431 |
| 2024 | $254 | $76,604 | $6,160 | $70,444 |
| 2023 | $0 | $77,766 | $6,160 | $71,606 |
| 2022 | $780 | $90,256 | $6,160 | $84,096 |
| 2021 | $415 | $89,696 | $5,600 | $84,096 |
| 2020 | $411 | $88,911 | $5,600 | $83,311 |
| 2019 | $555 | $85,690 | $4,200 | $81,490 |
| 2017 | $1,360 | $74,464 | $4,200 | $70,264 |
| 2016 | $1,459 | $73,008 | $2,744 | $70,264 |
| 2015 | $1,316 | $65,318 | $2,712 | $62,606 |
| 2014 | $1,316 | $59,380 | $2,465 | $56,915 |
Source: Public Records
Map
Nearby Homes
Your Personal Tour Guide
Ask me questions while you tour the home.