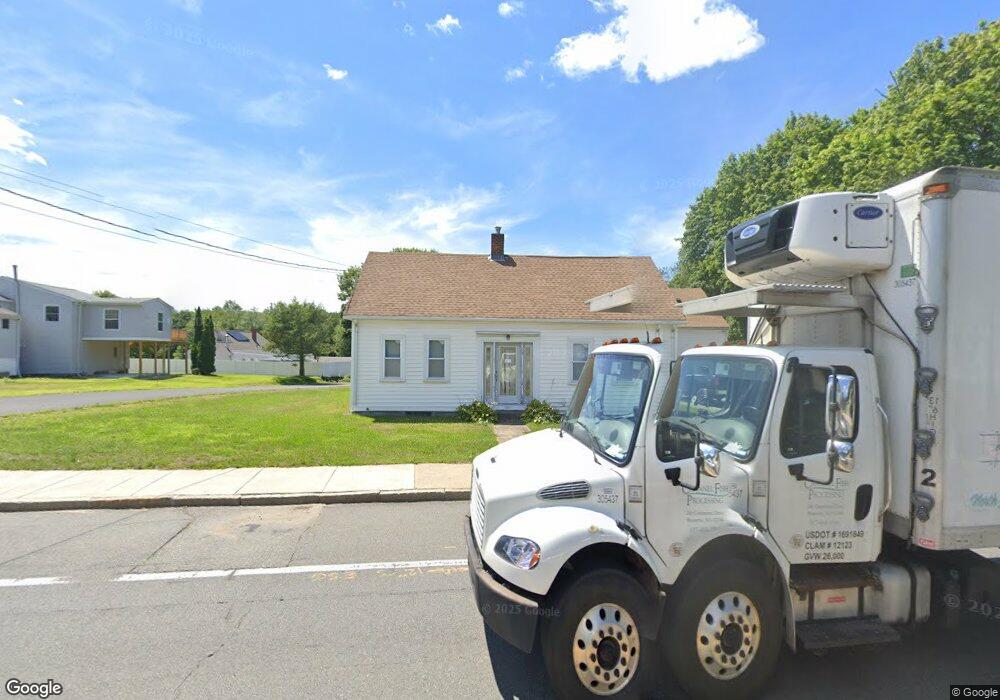
631 S Main St Randolph, MA 02368
South Randolph NeighborhoodEstimated Value: $641,767 - $760,000
4
Beds
2
Baths
2,087
Sq Ft
$345/Sq Ft
Est. Value
About This Home
This home is located at 631 S Main St, Randolph, MA 02368 and is currently estimated at $720,942, approximately $345 per square foot. 631 S Main St is a home located in Norfolk County with nearby schools including Randolph High School and Lighthouse Baptist Christian Academy.
Ownership History
Date
Name
Owned For
Owner Type
Purchase Details
Closed on
Apr 13, 2016
Sold by
Pham Thuy and Tran Phuc
Bought by
Pham Thuy and Pham Hung T
Current Estimated Value
Purchase Details
Closed on
Dec 1, 2008
Sold by
Kangiser Lorine A
Bought by
Tran Phuc and Pham Thuy
Home Financials for this Owner
Home Financials are based on the most recent Mortgage that was taken out on this home.
Original Mortgage
$265,567
Interest Rate
6.47%
Mortgage Type
Purchase Money Mortgage
Create a Home Valuation Report for This Property
The Home Valuation Report is an in-depth analysis detailing your home's value as well as a comparison with similar homes in the area
Home Values in the Area
Average Home Value in this Area
Purchase History
| Date | Buyer | Sale Price | Title Company |
|---|---|---|---|
| Pham Thuy | -- | -- | |
| Pham Thuy | -- | -- | |
| Tran Phuc | $290,000 | -- | |
| Tran Phuc | $290,000 | -- |
Source: Public Records
Mortgage History
| Date | Status | Borrower | Loan Amount |
|---|---|---|---|
| Previous Owner | Tran Phuc | $265,567 |
Source: Public Records
Tax History Compared to Growth
Tax History
| Year | Tax Paid | Tax Assessment Tax Assessment Total Assessment is a certain percentage of the fair market value that is determined by local assessors to be the total taxable value of land and additions on the property. | Land | Improvement |
|---|---|---|---|---|
| 2025 | $6,471 | $557,400 | $231,200 | $326,200 |
| 2024 | $6,362 | $555,600 | $226,700 | $328,900 |
| 2023 | $6,552 | $542,363 | $258,963 | $283,400 |
| 2022 | $6,398 | $470,415 | $216,015 | $254,400 |
| 2021 | $6,199 | $419,415 | $186,415 | $233,000 |
| 2020 | $6,064 | $406,715 | $186,415 | $220,300 |
| 2019 | $5,841 | $389,900 | $179,400 | $210,500 |
| 2018 | $5,679 | $357,600 | $166,600 | $191,000 |
| 2017 | $5,663 | $350,000 | $159,000 | $191,000 |
| 2016 | $5,485 | $315,400 | $144,700 | $170,700 |
| 2015 | $5,269 | $291,100 | $137,900 | $153,200 |
Source: Public Records
Map
Nearby Homes