631 Shepherds Crossing Unit LOT 37 Oxford, GA 30054
Walnut Grove NeighborhoodEstimated Value: $638,000 - $680,564
--
Bed
1
Bath
2,879
Sq Ft
$230/Sq Ft
Est. Value
About This Home
This home is located at 631 Shepherds Crossing Unit LOT 37, Oxford, GA 30054 and is currently estimated at $662,891, approximately $230 per square foot. 631 Shepherds Crossing Unit LOT 37 is a home located in Walton County with nearby schools including Walnut Grove Elementary School, Youth Middle School, and Walnut Grove High School.
Ownership History
Date
Name
Owned For
Owner Type
Purchase Details
Closed on
Dec 22, 2020
Sold by
Pearson Nicholas R
Bought by
Diller Jeffrey and Killer Leslie G
Current Estimated Value
Home Financials for this Owner
Home Financials are based on the most recent Mortgage that was taken out on this home.
Original Mortgage
$382,500
Outstanding Balance
$340,539
Interest Rate
2.7%
Mortgage Type
New Conventional
Estimated Equity
$322,352
Purchase Details
Closed on
Nov 22, 2013
Sold by
Mf Georgia Ii Llc
Bought by
Pearson Nicholas R and Pearson Roxy C
Home Financials for this Owner
Home Financials are based on the most recent Mortgage that was taken out on this home.
Original Mortgage
$13,600
Interest Rate
4.16%
Mortgage Type
New Conventional
Purchase Details
Closed on
Jul 1, 2008
Sold by
Madison Builders Llc
Bought by
Bank Of North Georgia
Create a Home Valuation Report for This Property
The Home Valuation Report is an in-depth analysis detailing your home's value as well as a comparison with similar homes in the area
Home Values in the Area
Average Home Value in this Area
Purchase History
| Date | Buyer | Sale Price | Title Company |
|---|---|---|---|
| Diller Jeffrey | $425,000 | -- | |
| Pearson Nicholas R | $17,000 | -- | |
| Bank Of North Georgia | $52,000 | -- |
Source: Public Records
Mortgage History
| Date | Status | Borrower | Loan Amount |
|---|---|---|---|
| Open | Diller Jeffrey | $382,500 | |
| Previous Owner | Pearson Nicholas R | $13,600 |
Source: Public Records
Tax History Compared to Growth
Tax History
| Year | Tax Paid | Tax Assessment Tax Assessment Total Assessment is a certain percentage of the fair market value that is determined by local assessors to be the total taxable value of land and additions on the property. | Land | Improvement |
|---|---|---|---|---|
| 2024 | $6,989 | $275,560 | $56,000 | $219,560 |
| 2023 | $6,625 | $268,120 | $56,000 | $212,120 |
| 2022 | $6,423 | $217,880 | $30,800 | $187,080 |
| 2021 | $5,599 | $180,080 | $30,800 | $149,280 |
| 2020 | $5,204 | $165,560 | $30,800 | $134,760 |
| 2019 | $5,104 | $154,760 | $30,800 | $123,960 |
| 2018 | $4,964 | $154,760 | $30,800 | $123,960 |
| 2017 | $5,250 | $152,360 | $30,800 | $121,560 |
| 2016 | $4,735 | $140,480 | $30,800 | $109,680 |
| 2015 | $369 | $9,240 | $9,240 | $0 |
| 2014 | $213 | $4,600 | $0 | $0 |
Source: Public Records
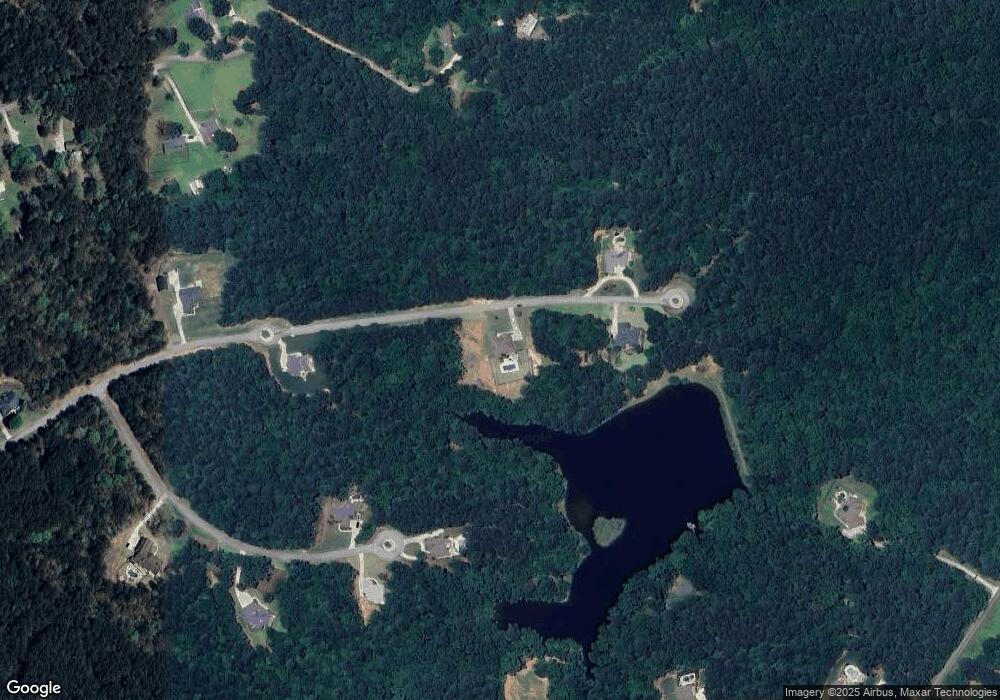
Map
Nearby Homes
- 4023 Jersey Covington Rd
- 4009 Jersey Covington Rd
- 1623 Pratt Rd
- 1585 Flat Rock Rd
- 827 Lake Varner Dr
- 4239 Lower Jersey Rd
- (GA)The Riley | Side Entry Plan at Ella Springs
- (GA) The Bentley | Side Entry Plan at Ella Springs
- (GA)Kirkland A.1 2 Side Entry Plan at Ella Springs
- 1611 Alcovy Station Rd
- 2121 Ella Springs Dr
- 620 Creekside Trace
- 550 Oak Ridge Dr SE
- 95 Wesleyan Way
- 168 Jersey Rd
- 165 Jersey Rd
- 130 Wesleyan Way
- 1041 Flat Rock Rd
- 1604 Greendale Rd
- 631 Shepherds Crossing
- 614 Shepherds Crossing
- 633 Shepherds Crossing
- 632 Shepherds Crossing Unit LOT 31
- 632 Shepherds Crossing
- 812 Saint Regis Way
- 635 Shepherds Crossing
- 630 Shepherds Crossing Unit LOT 30
- 630 Shepherds Crossing
- 634 Shepherds Crossing
- 634 Shepherds Crossing Unit 32
- 814 Saint Regis Way
- 810 Saint Regis Way Unit LOT 42
- 810 Saint Regis Way
- 810 St Regis Way Unit LOT 42
- 629 Shepherds Crossing
- 637 Shepherds Crossing
- 0 Shepherds Crossing Unit 8797169
- 0 Shepherds Crossing Unit 8243872
- 0 Shepherds Crossing Unit 8464330