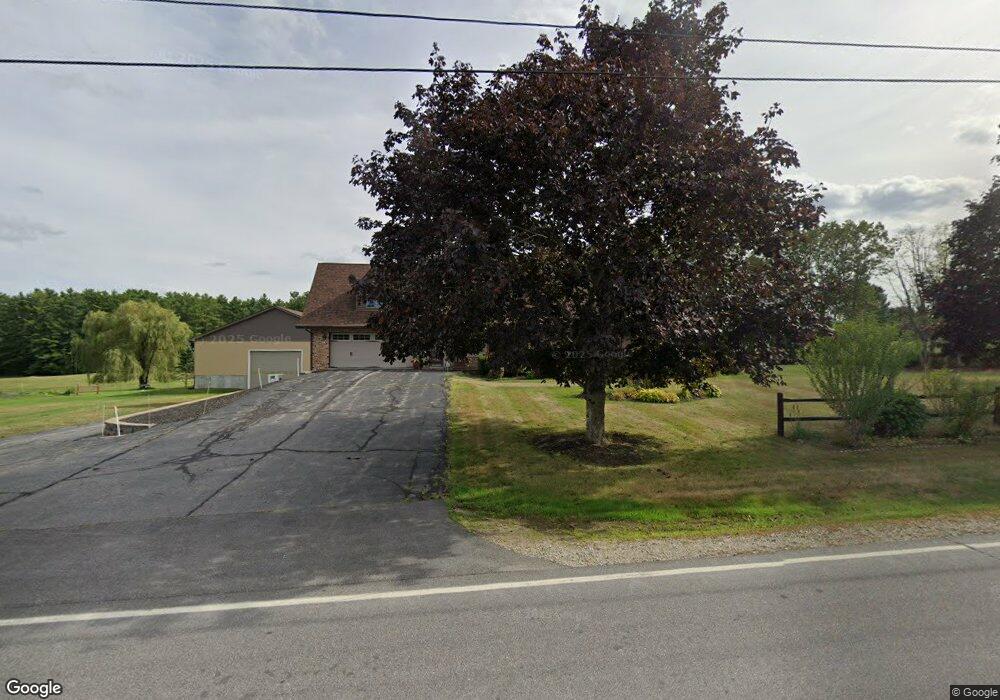
631 South St Biddeford, ME 04005
North Biddeford NeighborhoodEstimated Value: $777,000 - $952,000
5
Beds
3
Baths
4,301
Sq Ft
$198/Sq Ft
Est. Value
About This Home
This home is located at 631 South St, Biddeford, ME 04005 and is currently estimated at $850,662, approximately $197 per square foot. 631 South St is a home located in York County with nearby schools including John F Kennedy Memorial School, Biddeford Primary School, and Biddeford Intermediate School.
Ownership History
Date
Name
Owned For
Owner Type
Purchase Details
Closed on
Oct 21, 2010
Sold by
Hodgson Kimberly C
Bought by
Clarke Kimberly J and Hodgson Kimberly C
Current Estimated Value
Purchase Details
Closed on
Apr 27, 2006
Sold by
Rumney Richard A and Poore Paul R
Bought by
Hodgson Kimberly C
Home Financials for this Owner
Home Financials are based on the most recent Mortgage that was taken out on this home.
Original Mortgage
$269,000
Interest Rate
6.4%
Mortgage Type
Purchase Money Mortgage
Create a Home Valuation Report for This Property
The Home Valuation Report is an in-depth analysis detailing your home's value as well as a comparison with similar homes in the area
Home Values in the Area
Average Home Value in this Area
Purchase History
| Date | Buyer | Sale Price | Title Company |
|---|---|---|---|
| Clarke Kimberly J | -- | -- | |
| Hodgson Kimberly C | -- | -- |
Source: Public Records
Mortgage History
| Date | Status | Borrower | Loan Amount |
|---|---|---|---|
| Closed | Clarke Kimberly J | $231,000 | |
| Previous Owner | Hodgson Kimberly C | $269,000 |
Source: Public Records
Tax History Compared to Growth
Tax History
| Year | Tax Paid | Tax Assessment Tax Assessment Total Assessment is a certain percentage of the fair market value that is determined by local assessors to be the total taxable value of land and additions on the property. | Land | Improvement |
|---|---|---|---|---|
| 2024 | $9,017 | $634,100 | $164,300 | $469,800 |
| 2023 | $8,279 | $631,000 | $161,200 | $469,800 |
| 2022 | $8,553 | $521,200 | $72,400 | $448,800 |
| 2021 | $7,768 | $451,100 | $61,400 | $389,700 |
| 2020 | $7,170 | $357,600 | $51,800 | $305,800 |
| 2019 | $7,145 | $357,600 | $51,800 | $305,800 |
| 2018 | $43,634 | $357,600 | $51,800 | $305,800 |
| 2017 | $3,866 | $347,800 | $51,800 | $296,000 |
| 2016 | $6,907 | $347,800 | $51,800 | $296,000 |
| 2015 | $6,577 | $347,800 | $51,800 | $296,000 |
| 2014 | $6,415 | $347,800 | $51,800 | $296,000 |
| 2013 | -- | $352,100 | $59,800 | $292,300 |
Source: Public Records
Map
Nearby Homes