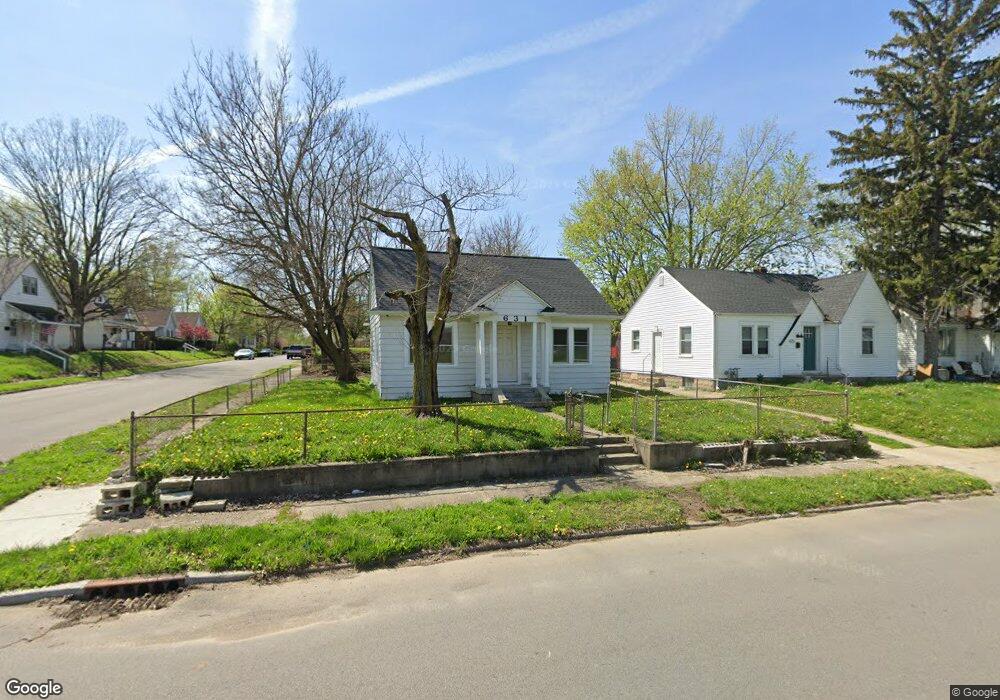
631 Sycamore St Anderson, IN 46016
Estimated Value: $67,000 - $104,000
2
Beds
1
Bath
1,540
Sq Ft
$54/Sq Ft
Est. Value
About This Home
This home is located at 631 Sycamore St, Anderson, IN 46016 and is currently estimated at $82,624, approximately $53 per square foot. 631 Sycamore St is a home located in Madison County with nearby schools including Eastside Elementary School, Highland Middle School, and Anderson High School.
Ownership History
Date
Name
Owned For
Owner Type
Purchase Details
Closed on
Nov 17, 2021
Sold by
Mullins Zachary T
Bought by
Equity Trust
Current Estimated Value
Purchase Details
Closed on
Oct 2, 2018
Sold by
Madison County Auditor
Bought by
Mullins Zachary T
Purchase Details
Closed on
Jan 12, 2007
Sold by
Wyatt Roger W and Wyatt Marianne
Bought by
Hillenburg Richard
Home Financials for this Owner
Home Financials are based on the most recent Mortgage that was taken out on this home.
Original Mortgage
$36,000
Interest Rate
6.55%
Mortgage Type
New Conventional
Create a Home Valuation Report for This Property
The Home Valuation Report is an in-depth analysis detailing your home's value as well as a comparison with similar homes in the area
Home Values in the Area
Average Home Value in this Area
Purchase History
| Date | Buyer | Sale Price | Title Company |
|---|---|---|---|
| Equity Trust | -- | New Title Company Name | |
| Mullins Zachary T | $1,550 | None Available | |
| Hillenburg Richard | -- | -- |
Source: Public Records
Mortgage History
| Date | Status | Borrower | Loan Amount |
|---|---|---|---|
| Previous Owner | Hillenburg Richard | $36,000 |
Source: Public Records
Tax History Compared to Growth
Tax History
| Year | Tax Paid | Tax Assessment Tax Assessment Total Assessment is a certain percentage of the fair market value that is determined by local assessors to be the total taxable value of land and additions on the property. | Land | Improvement |
|---|---|---|---|---|
| 2024 | $696 | $31,300 | $4,000 | $27,300 |
| 2023 | $640 | $28,600 | $3,800 | $24,800 |
| 2022 | $642 | $28,700 | $3,600 | $25,100 |
| 2021 | $585 | $26,000 | $3,500 | $22,500 |
| 2020 | $558 | $24,700 | $3,300 | $21,400 |
| 2019 | $730 | $24,200 | $3,300 | $20,900 |
| 2018 | $465 | $30,700 | $3,300 | $27,400 |
| 2017 | $303 | $30,300 | $3,300 | $27,000 |
| 2016 | $692 | $30,300 | $3,300 | $27,000 |
| 2014 | $239 | $31,100 | $3,200 | $27,900 |
| 2013 | $239 | $31,100 | $3,200 | $27,900 |
Source: Public Records
Map
Nearby Homes