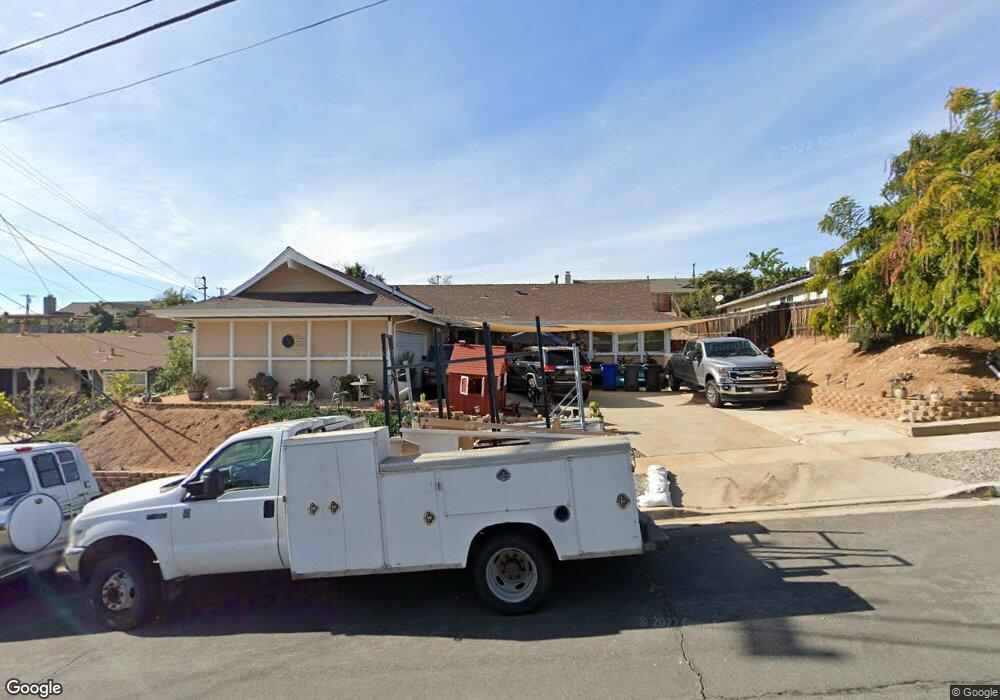
6310 Henderson Dr La Mesa, CA 91942
Fletcher Hills NeighborhoodEstimated Value: $794,283 - $862,000
3
Beds
2
Baths
1,492
Sq Ft
$556/Sq Ft
Est. Value
About This Home
This home is located at 6310 Henderson Dr, La Mesa, CA 91942 and is currently estimated at $828,821, approximately $555 per square foot. 6310 Henderson Dr is a home located in San Diego County with nearby schools including Northmont Elementary School, Parkway Academy, and Grossmont High School.
Ownership History
Date
Name
Owned For
Owner Type
Purchase Details
Closed on
Jun 25, 2009
Sold by
Binns Craig A and Binns Pamela S
Bought by
Binns Craig A and Binns Pamela S
Current Estimated Value
Purchase Details
Closed on
Apr 10, 2007
Sold by
Binns Pamela Sue
Bought by
Binns Pamela Sue
Purchase Details
Closed on
Apr 26, 2000
Sold by
Brady James G and Brady Leona M
Bought by
Brady James Gilmore and Brady Leona Margarette
Create a Home Valuation Report for This Property
The Home Valuation Report is an in-depth analysis detailing your home's value as well as a comparison with similar homes in the area
Home Values in the Area
Average Home Value in this Area
Purchase History
| Date | Buyer | Sale Price | Title Company |
|---|---|---|---|
| Binns Craig A | -- | None Available | |
| Binns Craig A | -- | None Available | |
| Binns Pamela Sue | -- | None Available | |
| Brady James Gilmore | -- | -- |
Source: Public Records
Tax History
| Year | Tax Paid | Tax Assessment Tax Assessment Total Assessment is a certain percentage of the fair market value that is determined by local assessors to be the total taxable value of land and additions on the property. | Land | Improvement |
|---|---|---|---|---|
| 2025 | $1,897 | $96,498 | $27,916 | $68,582 |
| 2024 | $1,897 | $94,607 | $27,369 | $67,238 |
| 2023 | $1,803 | $92,753 | $26,833 | $65,920 |
| 2022 | $1,727 | $90,935 | $26,307 | $64,628 |
| 2021 | $1,611 | $89,153 | $25,792 | $63,361 |
| 2020 | $1,469 | $88,240 | $25,528 | $62,712 |
| 2019 | $1,349 | $86,511 | $25,028 | $61,483 |
| 2018 | $1,321 | $84,816 | $24,538 | $60,278 |
| 2017 | $1,301 | $83,154 | $24,057 | $59,097 |
| 2016 | $1,255 | $81,525 | $23,586 | $57,939 |
| 2015 | $1,246 | $80,301 | $23,232 | $57,069 |
| 2014 | $1,223 | $78,729 | $22,777 | $55,952 |
Source: Public Records
Map
Nearby Homes
- 132 Croydon Ln
- 2216 Charles Way
- 9367 De Camp Dr
- 1894 Wedgemere Rd
- 1760 Essex St
- 6130 Howell Dr
- 9320 Earl St Unit 44
- 9185 Altamont Rd
- 296 Southern Rd
- 5935 Joel Ln
- 5750 Amaya Dr Unit 44
- 2679 Ferdinand Rd
- 5931 Howell Dr
- 5815 Amaya Dr
- 157 Thrasher Way
- 302 Travelodge Dr
- 5642 Amaya Dr Unit 98
- 1280 W Main St Unit 21
- 1280 W Main St Unit 15
- 1787 Galway Place
- 6290 Henderson Dr
- 6320 Henderson Dr
- 6295 Cresthaven Dr
- 6305 Cresthaven Dr
- 6285 Cresthaven Dr
- 6280 Henderson Dr
- 6325 Cresthaven Dr
- 6330 Henderson Dr
- 6305 Henderson Dr
- 6315 Henderson Dr
- 6275 Cresthaven Dr
- 6335 Cresthaven Dr
- 6285 Henderson Dr
- 6270 Henderson Dr
- 6340 Henderson Dr
- 6330 Fernwood Dr
- 6265 Cresthaven Dr
- 6345 Cresthaven Dr
- 6310 Fernwood Dr
- 6275 Henderson Dr
Your Personal Tour Guide
Ask me questions while you tour the home.