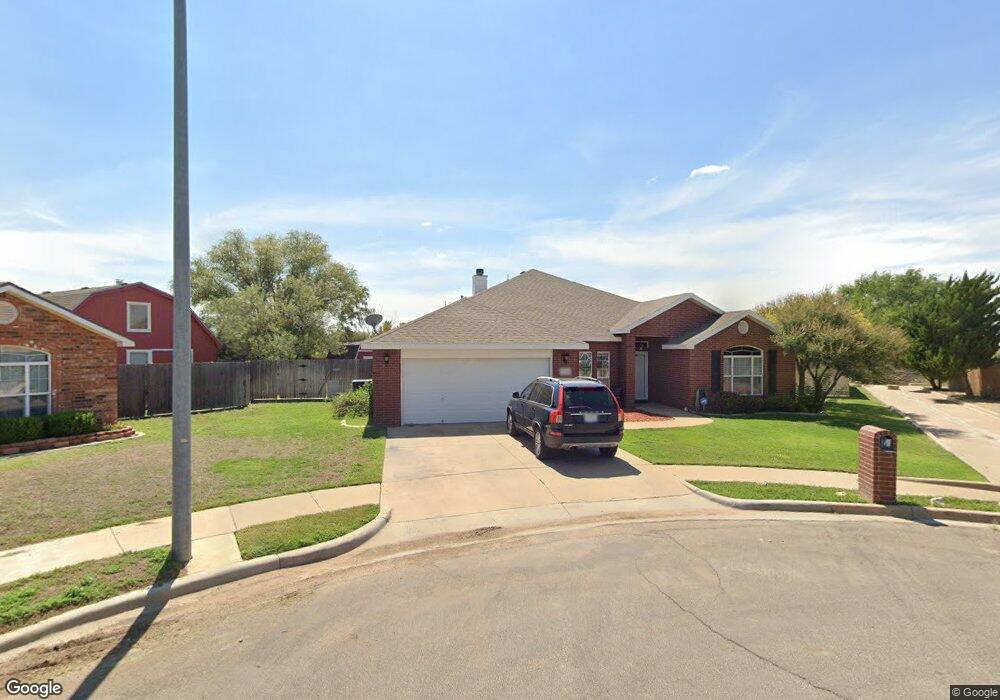
6311 Dupage Ave Lubbock, TX 79416
Shadow Hills NeighborhoodEstimated Value: $283,000 - $321,820
4
Beds
2
Baths
2,629
Sq Ft
$116/Sq Ft
Est. Value
About This Home
This home is located at 6311 Dupage Ave, Lubbock, TX 79416 and is currently estimated at $305,205, approximately $116 per square foot. 6311 Dupage Ave is a home located in Lubbock County with nearby schools including North Ridge Elementary School, Terra Vista Middle School, and Frenship High School.
Ownership History
Date
Name
Owned For
Owner Type
Purchase Details
Closed on
Dec 4, 2014
Sold by
Malnory Michael Robert
Bought by
Sloan Floyd Edward and Sloan Kimberly Dawn
Current Estimated Value
Home Financials for this Owner
Home Financials are based on the most recent Mortgage that was taken out on this home.
Original Mortgage
$120,000
Outstanding Balance
$91,953
Interest Rate
3.93%
Mortgage Type
Purchase Money Mortgage
Estimated Equity
$213,252
Purchase Details
Closed on
Aug 21, 2014
Sold by
Carlock Stacie and Carlock Zackery D
Bought by
Malnory Michael
Home Financials for this Owner
Home Financials are based on the most recent Mortgage that was taken out on this home.
Original Mortgage
$167,000
Interest Rate
4.15%
Mortgage Type
Purchase Money Mortgage
Purchase Details
Closed on
Jul 6, 2011
Sold by
Davenport Johnny C and Davenport Anna C
Bought by
Carlock Stacie
Home Financials for this Owner
Home Financials are based on the most recent Mortgage that was taken out on this home.
Original Mortgage
$151,070
Interest Rate
4.5%
Mortgage Type
FHA
Create a Home Valuation Report for This Property
The Home Valuation Report is an in-depth analysis detailing your home's value as well as a comparison with similar homes in the area
Home Values in the Area
Average Home Value in this Area
Purchase History
| Date | Buyer | Sale Price | Title Company |
|---|---|---|---|
| Sloan Floyd Edward | -- | None Available | |
| Sloan Floyd Edward | -- | None Available | |
| Malnory Michael | -- | Western Title Co | |
| Malnory Michael | -- | Western Title Co | |
| Carlock Stacie | -- | Service Title | |
| Carlock Stacie | -- | Service Title |
Source: Public Records
Mortgage History
| Date | Status | Borrower | Loan Amount |
|---|---|---|---|
| Open | Sloan Floyd Edward | $120,000 | |
| Previous Owner | Malnory Michael | $167,000 | |
| Previous Owner | Carlock Stacie | $151,070 |
Source: Public Records
Tax History Compared to Growth
Tax History
| Year | Tax Paid | Tax Assessment Tax Assessment Total Assessment is a certain percentage of the fair market value that is determined by local assessors to be the total taxable value of land and additions on the property. | Land | Improvement |
|---|---|---|---|---|
| 2025 | $5,602 | $311,171 | $21,284 | $289,887 |
| 2024 | $5,602 | $327,400 | $21,284 | $306,116 |
| 2023 | $6,340 | $302,774 | $21,284 | $281,490 |
| 2022 | $6,267 | $275,249 | $21,284 | $263,856 |
| 2021 | $6,051 | $250,226 | $21,284 | $228,942 |
| 2020 | $5,626 | $231,592 | $21,284 | $210,308 |
| 2019 | $5,852 | $234,066 | $21,284 | $212,782 |
| 2018 | $5,584 | $223,087 | $21,284 | $201,803 |
| 2017 | $5,435 | $216,901 | $21,284 | $195,617 |
| 2016 | $5,189 | $207,082 | $21,284 | $185,798 |
| 2015 | $4,345 | $194,045 | $21,284 | $172,761 |
| 2014 | $4,345 | $182,299 | $21,284 | $161,015 |
Source: Public Records
Map
Nearby Homes
- 515 N Juneau Ave
- 533 N Kirby Ave
- 54 Amesbury Ct
- 517 N Hyden Ave
- 48 Wilshire Blvd
- 11 Wilshire Blvd
- 37 Wilshire Blvd
- 72 Windsor Ct
- 502 N Homestead Ave
- 18 Wilshire Blvd
- 20 Wilshire Blvd
- 6107 Private Road 6470
- 512 N Grover Ave
- 805 N Grover Ave
- 5921 Harvard St
- 5909 Grinnell St
- 5908 Grinnell St
- 1212 N Fulton Ave
- 1023 N Fulton Ave
- 6604 3rd St