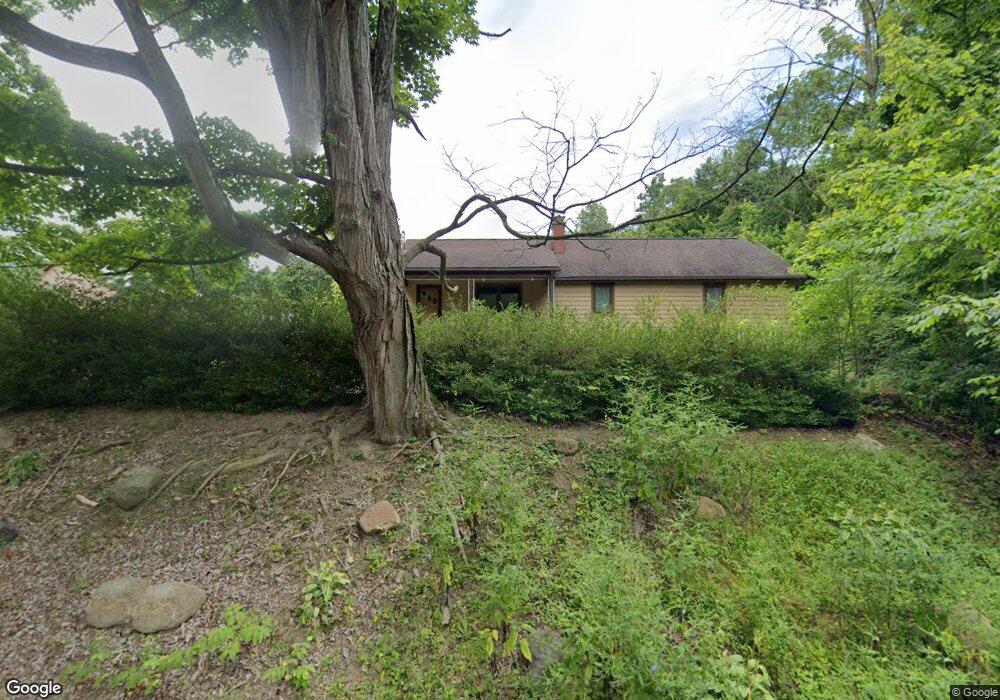
6312 Howard Rd Sunbury, OH 43074
Estimated Value: $421,000 - $612,000
3
Beds
2
Baths
2,392
Sq Ft
$223/Sq Ft
Est. Value
About This Home
This home is located at 6312 Howard Rd, Sunbury, OH 43074 and is currently estimated at $533,241, approximately $222 per square foot. 6312 Howard Rd is a home located in Delaware County with nearby schools including Buckeye Valley High School.
Ownership History
Date
Name
Owned For
Owner Type
Purchase Details
Closed on
Nov 30, 2012
Sold by
Capwell Lan P and Capwell Amber L
Bought by
Capwell Ian P and Capwell Amber L
Current Estimated Value
Purchase Details
Closed on
Apr 27, 2005
Sold by
Clay Patricia Jean and Clay Paul A
Bought by
Capwell Ian P
Home Financials for this Owner
Home Financials are based on the most recent Mortgage that was taken out on this home.
Original Mortgage
$135,000
Outstanding Balance
$71,382
Interest Rate
6.06%
Mortgage Type
Fannie Mae Freddie Mac
Estimated Equity
$461,859
Purchase Details
Closed on
Apr 25, 2005
Sold by
Flahive Edward F
Bought by
Clay Patricia Jean
Home Financials for this Owner
Home Financials are based on the most recent Mortgage that was taken out on this home.
Original Mortgage
$135,000
Outstanding Balance
$71,382
Interest Rate
6.06%
Mortgage Type
Fannie Mae Freddie Mac
Estimated Equity
$461,859
Purchase Details
Closed on
Apr 23, 2005
Sold by
Clay Patricia Jean and Clay Paul A
Bought by
Flahive Edward F
Home Financials for this Owner
Home Financials are based on the most recent Mortgage that was taken out on this home.
Original Mortgage
$135,000
Outstanding Balance
$71,382
Interest Rate
6.06%
Mortgage Type
Fannie Mae Freddie Mac
Estimated Equity
$461,859
Create a Home Valuation Report for This Property
The Home Valuation Report is an in-depth analysis detailing your home's value as well as a comparison with similar homes in the area
Home Values in the Area
Average Home Value in this Area
Purchase History
| Date | Buyer | Sale Price | Title Company |
|---|---|---|---|
| Capwell Ian P | -- | None Available | |
| Capwell Ian P | $175,000 | -- | |
| Clay Patricia Jean | -- | -- | |
| Flahive Edward F | -- | -- |
Source: Public Records
Mortgage History
| Date | Status | Borrower | Loan Amount |
|---|---|---|---|
| Open | Capwell Ian P | $135,000 |
Source: Public Records
Tax History Compared to Growth
Tax History
| Year | Tax Paid | Tax Assessment Tax Assessment Total Assessment is a certain percentage of the fair market value that is determined by local assessors to be the total taxable value of land and additions on the property. | Land | Improvement |
|---|---|---|---|---|
| 2024 | $5,683 | $149,070 | $49,460 | $99,610 |
| 2023 | $5,308 | $149,070 | $49,460 | $99,610 |
| 2022 | $4,736 | $118,760 | $44,240 | $74,520 |
| 2021 | $4,740 | $118,760 | $44,240 | $74,520 |
| 2020 | $4,771 | $118,760 | $44,240 | $74,520 |
| 2019 | $4,221 | $96,460 | $30,520 | $65,940 |
| 2018 | $4,282 | $96,460 | $30,520 | $65,940 |
| 2017 | $3,488 | $75,750 | $24,260 | $51,490 |
| 2016 | $3,160 | $75,750 | $24,260 | $51,490 |
| 2015 | $2,981 | $67,910 | $24,260 | $43,650 |
| 2014 | $2,557 | $61,610 | $24,260 | $37,350 |
| 2013 | $2,372 | $56,500 | $24,260 | $32,240 |
Source: Public Records
Map
Nearby Homes
- 6239 Howard Rd
- 6824 Linda Ln
- 455 N 3 Bs and K Rd
- 695 Otter Tail Dr
- 785 Habitat Way
- 6972 Turnstone Loop
- 7458 Quailview Dr
- 7900 Berkshire Rd
- 1187 Ivy Wood Dr
- 6914 Oxford Woods Dr
- 1278 Ivy Wood Dr
- 1068 Ivy Wood Dr
- 8371 Spenwood Way
- 8356 Spenwood Way
- 1779 N Galena Rd
- 8296 Spenwood Way
- 5995 Sycamore Trail Dr
- 8619 Landrace Place
- 1138 Forsyth Ln
- 8699 Greenburst Ct
- 0 Howard Rd Unit Lot 169 2754752
- 0 Howard Rd Unit 220043895
- 0 Howard Rd Unit 220041328
- 0 Howard Rd Unit Tract 7
- 6315 Howard Rd
- 6267 Howard Rd
- 6400 Howard Rd
- 6355 Howard Rd
- 6395 Howard Rd
- 1433 Hogback Rd
- 6219 Howard Rd
- 1415 Hogback Rd
- 1483 Hogback Rd
- 1461 Hogback Rd
- 6482 Howard Rd
- 6181 Howard Rd
- 6229 Howard Rd
- 1584 Hogback Rd
- 6500 Howard Rd
- 6537 Howard Rd