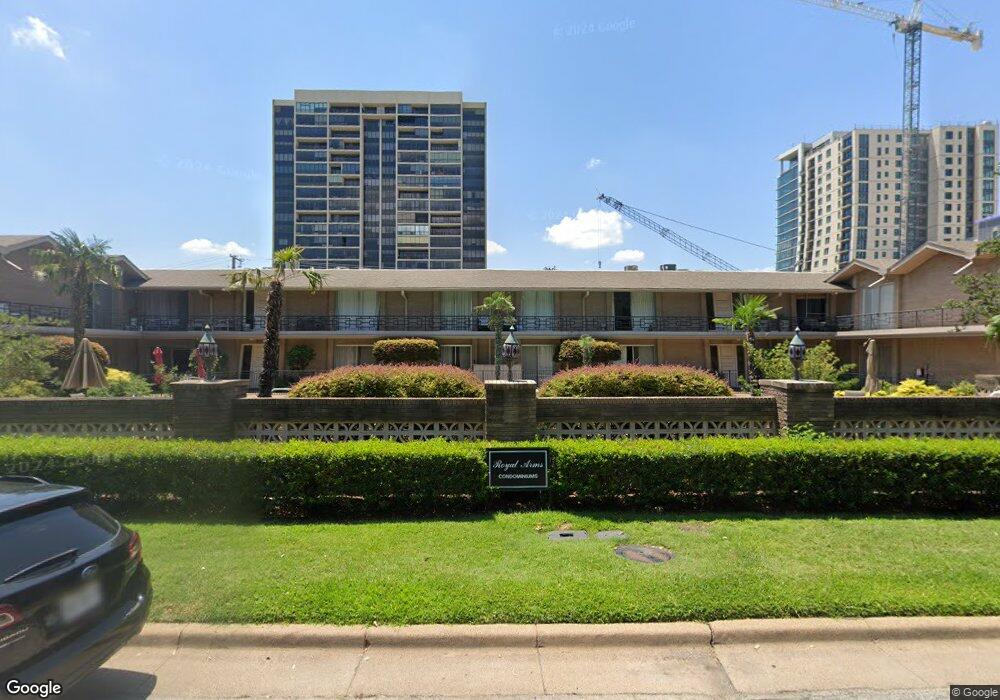
6314A Bandera Ave Unit 6314A Dallas, TX 75225
Preston Hollow NeighborhoodEstimated Value: $356,000 - $520,223
2
Beds
2
Baths
1,947
Sq Ft
$219/Sq Ft
Est. Value
About This Home
This home is located at 6314A Bandera Ave Unit 6314A, Dallas, TX 75225 and is currently estimated at $426,306, approximately $218 per square foot. 6314A Bandera Ave Unit 6314A is a home located in Dallas County with nearby schools including Benjamin Franklin International Exploratory Academy, Hillcrest High School, and Meadowbrook School.
Ownership History
Date
Name
Owned For
Owner Type
Purchase Details
Closed on
Feb 24, 2025
Sold by
Turner Myra Joy and Turner Partick J
Bought by
Macias Daniela Virues
Current Estimated Value
Home Financials for this Owner
Home Financials are based on the most recent Mortgage that was taken out on this home.
Original Mortgage
$255,000
Outstanding Balance
$253,737
Interest Rate
7.04%
Mortgage Type
New Conventional
Estimated Equity
$172,569
Purchase Details
Closed on
Aug 15, 2006
Sold by
Sorrells Jean
Bought by
Turner Myra Joy
Purchase Details
Closed on
May 15, 2000
Sold by
Mclelland Marjorie Jean
Bought by
Sorrells Jean
Home Financials for this Owner
Home Financials are based on the most recent Mortgage that was taken out on this home.
Original Mortgage
$235,000
Interest Rate
8.14%
Create a Home Valuation Report for This Property
The Home Valuation Report is an in-depth analysis detailing your home's value as well as a comparison with similar homes in the area
Home Values in the Area
Average Home Value in this Area
Purchase History
| Date | Buyer | Sale Price | Title Company |
|---|---|---|---|
| Macias Daniela Virues | -- | None Listed On Document | |
| Turner Myra Joy | -- | Atc | |
| Sorrells Jean | -- | -- |
Source: Public Records
Mortgage History
| Date | Status | Borrower | Loan Amount |
|---|---|---|---|
| Open | Macias Daniela Virues | $255,000 | |
| Previous Owner | Sorrells Jean | $235,000 |
Source: Public Records
Tax History Compared to Growth
Tax History
| Year | Tax Paid | Tax Assessment Tax Assessment Total Assessment is a certain percentage of the fair market value that is determined by local assessors to be the total taxable value of land and additions on the property. | Land | Improvement |
|---|---|---|---|---|
| 2025 | $6,839 | $360,200 | $180,840 | $179,360 |
| 2024 | $6,839 | $350,460 | $180,840 | $169,620 |
| 2023 | $6,839 | $255,000 | $139,110 | $115,890 |
| 2022 | $6,376 | $255,000 | $139,110 | $115,890 |
| 2021 | $6,727 | $255,000 | $139,110 | $115,890 |
| 2020 | $6,338 | $233,640 | $139,110 | $94,530 |
| 2019 | $6,648 | $233,640 | $139,110 | $94,530 |
| 2018 | $6,089 | $223,910 | $139,110 | $84,800 |
| 2017 | $4,236 | $155,760 | $83,460 | $72,300 |
| 2016 | $4,236 | $155,760 | $83,460 | $72,300 |
| 2015 | $1,626 | $163,550 | $44,510 | $119,040 |
| 2014 | $1,626 | $143,790 | $44,510 | $99,280 |
Source: Public Records
Map
Nearby Homes
- 6314 Bandera Ave Unit C
- 6320 Bandera Ave Unit A
- 6345 Bandera Ave Unit 11
- 6337 Bandera Ave Unit D
- 6236 Del Norte Ln
- 6335 W Northwest Hwy Unit 918
- 6335 W Northwest Hwy Unit 1417
- 6335 W Northwest Hwy Unit 1314
- 6230 Bandera Ave Unit A
- 8619 Edgemere Rd Unit 3
- 6227 Bandera Ave Unit D
- 6235 Bandera Ave Unit D
- 3829 Northwest Pkwy
- 6211 W NW Unit 701
- 6211 W Northwest Hwy Unit 2306
- 6211 W Northwest Hwy Unit G514
- 6211 W Northwest Hwy Unit 700
- 6211 W Northwest Hwy Unit 500
- 6211 W Northwest Hwy Unit 2005
- 6211 W Northwest Hwy Unit G710
- 6318 Bandera Ave Unit E
- 6318 Bandera Ave Unit B
- 6310A Bandera Ave Unit 6310A
- 6318B Bandera Ave Unit 6318E
- 6320A Bandera Ave Unit 6320D
- 6320A Bandera Ave Unit 6320C
- 6320A Bandera Ave Unit 6320B
- 6320A Bandera Ave Unit 6320A
- 6314A Bandera Ave Unit 6314D
- 6314A Bandera Ave Unit 6314C
- 6314A Bandera Ave Unit 6314B
- 6310A Bandera Ave Unit 6310D
- 6310A Bandera Ave Unit 6310C
- 6310A Bandera Ave Unit 6310B
- 6328 Bandera Ave Unit D
- 6328 Bandera Ave
- 6318 Bandera Ave Unit D
- 6318 Bandera Ave Unit 6318C
- 6328 Bandera Ave Unit 6328C
- 6328 Bandera Ave Unit 6328 A