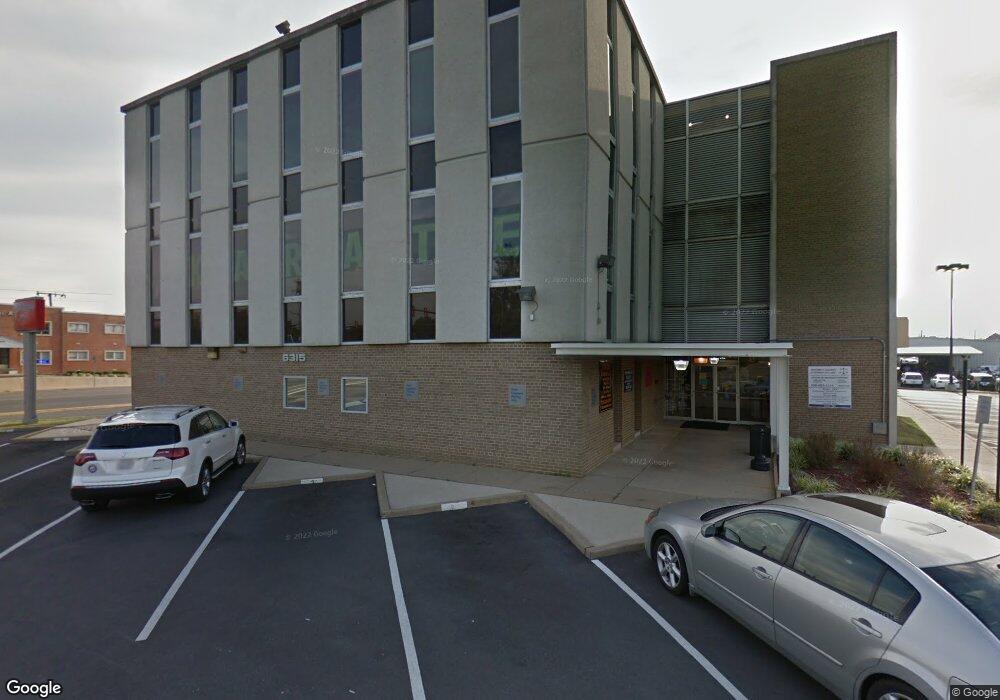
6315 Backlick Rd Springfield, VA 22150
Estimated Value: $4,068,051
Studio
--
Bath
19,631
Sq Ft
$207/Sq Ft
Est. Value
About This Home
This home is located at 6315 Backlick Rd, Springfield, VA 22150 and is currently estimated at $4,068,051, approximately $207 per square foot. 6315 Backlick Rd is a home located in Fairfax County with nearby schools including Lynbrook Elementary School, Key Middle, and Lewis High School.
Ownership History
Date
Name
Owned For
Owner Type
Purchase Details
Closed on
Jun 29, 2023
Sold by
S & F Associates Inc
Bought by
Aj & Family Investment Llc
Current Estimated Value
Purchase Details
Closed on
Apr 28, 2011
Sold by
Mrs Real Estate Investment Pro
Bought by
S And F Associates Inc
Home Financials for this Owner
Home Financials are based on the most recent Mortgage that was taken out on this home.
Original Mortgage
$1,552,000
Interest Rate
4.82%
Mortgage Type
Commercial
Purchase Details
Closed on
Jul 19, 2007
Sold by
First States Investors 52
Bought by
Mrs Real Estate Inv Properties
Home Financials for this Owner
Home Financials are based on the most recent Mortgage that was taken out on this home.
Original Mortgage
$1,400,000
Interest Rate
6.54%
Mortgage Type
Commercial
Purchase Details
Closed on
Oct 1, 2004
Sold by
Bank Of America N A
Bought by
First States Investors 5200
Create a Home Valuation Report for This Property
The Home Valuation Report is an in-depth analysis detailing your home's value as well as a comparison with similar homes in the area
Home Values in the Area
Average Home Value in this Area
Purchase History
| Date | Buyer | Sale Price | Title Company |
|---|---|---|---|
| Aj & Family Investment Llc | $3,800,000 | First American Title | |
| Aj & Family Investment Llc | $3,800,000 | First American Title | |
| S And F Associates Inc | $2,940,000 | -- | |
| Mrs Real Estate Inv Properties | $2,500,000 | -- | |
| First States Investors 5200 | $1,351,205 | -- |
Source: Public Records
Mortgage History
| Date | Status | Borrower | Loan Amount |
|---|---|---|---|
| Previous Owner | S And F Associates Inc | $1,552,000 | |
| Previous Owner | Mrs Real Estate Inv Properties | $1,400,000 |
Source: Public Records
Tax History
| Year | Tax Paid | Tax Assessment Tax Assessment Total Assessment is a certain percentage of the fair market value that is determined by local assessors to be the total taxable value of land and additions on the property. | Land | Improvement |
|---|---|---|---|---|
| 2025 | $45,005 | $3,563,430 | $2,121,690 | $1,441,740 |
| 2023 | $42,538 | $3,393,510 | $2,121,690 | $1,271,820 |
| 2022 | $45,186 | $3,562,180 | $2,121,690 | $1,440,490 |
| 2021 | $45,116 | $3,474,440 | $2,121,690 | $1,352,750 |
| 2020 | $45,079 | $3,445,060 | $2,233,360 | $1,211,700 |
| 2019 | $46,987 | $3,590,940 | $1,223,480 | $2,367,460 |
| 2018 | $41,000 | $3,565,240 | $1,223,480 | $2,341,760 |
| 2017 | $46,598 | $3,623,500 | $1,223,480 | $2,400,020 |
| 2016 | $43,673 | $3,402,620 | $1,233,850 | $2,168,770 |
Source: Public Records
Map
Nearby Homes
- 6703 Cimarron St
- 7039 Calamo St
- 5907 Camberly Ave
- 7213 Calamo St
- 6502 Milva Ln
- 6124 Crozet Ct
- 7435 Bath St
- 6476 Franconia Ct
- 6917 Villa Del Rey Ct
- 6613 Elder Ave
- 7227 Evanston Rd
- 6009 Jennings Ln
- 6430 Franconia Rd
- 5937 Atteentee Rd
- 7204 Lavender Ln
- 6816 Mayo Ct
- 6916 Ruskin St
- 6348 Dakine Cir
- 7745 Tiverton Dr
- 6810 Mayo Ct
- 6315 Backlick Rd
- 6331 Backlick Rd
- 6801 Commerce St
- 6828 Commerce St Unit G-1
- 6828 Commerce St
- 6236 Backlick Rd
- 6315 Amherst Ave
- 6820 Commerce St
- 6225 Backlick Rd
- 6220 Backlick Rd
- 6800 Commerce St
- 6400 Backlick Rd
- 6804 Commerce St
- 6210 Backlick Rd
- 6411 Backlick Rd
- 6409 Backlick Rd
- 6410 Backlick Rd
- 6302 Springfield Plaza
- 6119 Backlick Rd
- 6300 Springfield Plaza
Your Personal Tour Guide
Ask me questions while you tour the home.