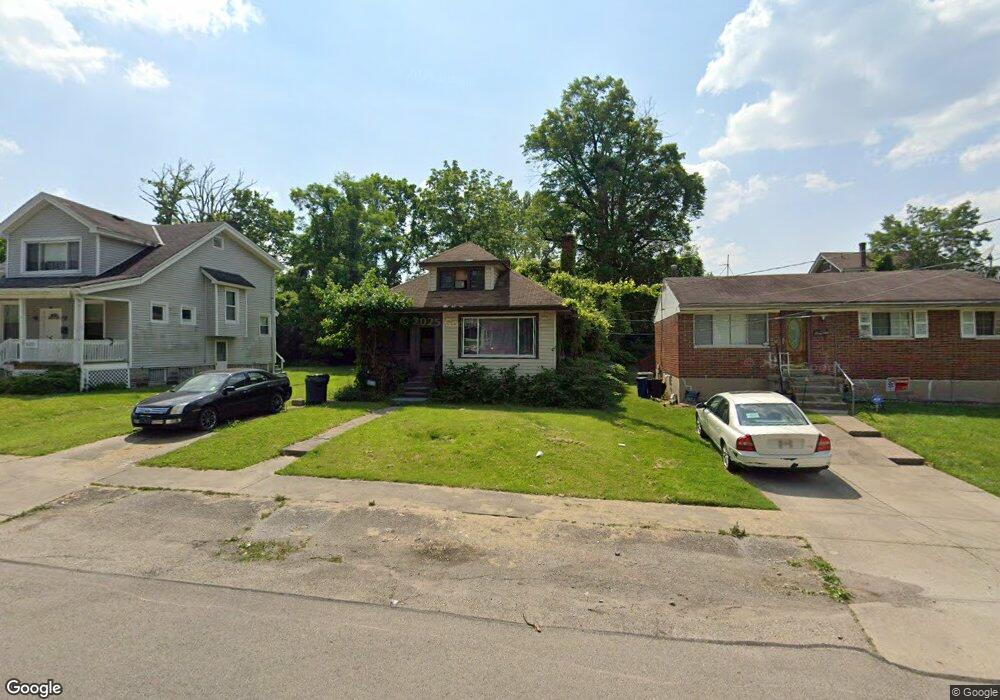
6315 Coleridge Ave Cincinnati, OH 45213
Kennedy Heights NeighborhoodEstimated Value: $214,000 - $247,000
2
Beds
1
Bath
1,933
Sq Ft
$123/Sq Ft
Est. Value
About This Home
This home is located at 6315 Coleridge Ave, Cincinnati, OH 45213 and is currently estimated at $236,921, approximately $122 per square foot. 6315 Coleridge Ave is a home located in Hamilton County with nearby schools including John P. Parker School, Shroder High School, and Clark Montessori High School.
Ownership History
Date
Name
Owned For
Owner Type
Purchase Details
Closed on
Feb 18, 2020
Sold by
Gowda Srinivasa R
Bought by
Srini Gowda Builders Llc
Current Estimated Value
Purchase Details
Closed on
Apr 17, 2009
Sold by
Gowda Srinivasa R
Bought by
Briscoe Robert E
Home Financials for this Owner
Home Financials are based on the most recent Mortgage that was taken out on this home.
Original Mortgage
$92,000
Outstanding Balance
$54,418
Interest Rate
3.77%
Mortgage Type
Seller Take Back
Estimated Equity
$182,503
Purchase Details
Closed on
Jun 28, 2004
Sold by
Federal Home Loan Mortgage Corporation
Bought by
Gowda Srinivasa R
Home Financials for this Owner
Home Financials are based on the most recent Mortgage that was taken out on this home.
Original Mortgage
$60,800
Interest Rate
6.39%
Mortgage Type
Unknown
Purchase Details
Closed on
Jul 3, 2000
Sold by
Estate Of Loretha Cutright
Bought by
Brown Carol
Purchase Details
Closed on
Sep 28, 1995
Sold by
Cutright Paul and Cutright Loureatha
Bought by
Cutright Paul and Cutright Loretha
Home Financials for this Owner
Home Financials are based on the most recent Mortgage that was taken out on this home.
Original Mortgage
$36,500
Interest Rate
7.8%
Create a Home Valuation Report for This Property
The Home Valuation Report is an in-depth analysis detailing your home's value as well as a comparison with similar homes in the area
Home Values in the Area
Average Home Value in this Area
Purchase History
| Date | Buyer | Sale Price | Title Company |
|---|---|---|---|
| Srini Gowda Builders Llc | -- | None Available | |
| Briscoe Robert E | $92,000 | None Available | |
| Gowda Srinivasa R | -- | -- | |
| Brown Carol | -- | -- | |
| Cutright Paul | -- | -- |
Source: Public Records
Mortgage History
| Date | Status | Borrower | Loan Amount |
|---|---|---|---|
| Open | Briscoe Robert E | $92,000 | |
| Closed | Gowda Srinivasa R | $60,800 | |
| Previous Owner | Cutright Paul | $36,500 |
Source: Public Records
Tax History Compared to Growth
Tax History
| Year | Tax Paid | Tax Assessment Tax Assessment Total Assessment is a certain percentage of the fair market value that is determined by local assessors to be the total taxable value of land and additions on the property. | Land | Improvement |
|---|---|---|---|---|
| 2024 | $3,194 | $50,295 | $10,500 | $39,795 |
| 2023 | $3,199 | $50,295 | $10,500 | $39,795 |
| 2022 | $1,883 | $26,541 | $9,492 | $17,049 |
| 2021 | $1,847 | $26,541 | $9,492 | $17,049 |
| 2020 | $1,852 | $26,541 | $9,492 | $17,049 |
| 2019 | $1,801 | $23,489 | $8,400 | $15,089 |
| 2018 | $1,803 | $23,489 | $8,400 | $15,089 |
| 2017 | $1,736 | $23,489 | $8,400 | $15,089 |
| 2016 | $2,208 | $29,176 | $8,820 | $20,356 |
| 2015 | $1,974 | $29,176 | $8,820 | $20,356 |
| 2014 | $1,985 | $29,176 | $8,820 | $20,356 |
| 2013 | $1,923 | $27,787 | $8,400 | $19,387 |
Source: Public Records
Map
Nearby Homes
- 6218 Coleridge Ave
- 6212 Coleridge Ave
- 3717 Standish Ave
- 6502 Coleridge Ave
- 6508 Coleridge Ave
- 6218 Kennedy Ave
- 6456 Mchugh Place
- 6460 Mchugh Place
- 3824 Standish Ave
- 3751 Dunloe Ave
- 6321 Tyne Ave
- 3635 Northdale Place
- 6256 Rogers Park Place
- 6047 Kennedy Ave
- 6063 Woodford Ct
- 6631 Ravenal Ct
- 6124 Hedge Ave
- 6250 Beech View Cir
- 6535 Highland Ave
- 6914 Montgomery Rd
- 6317 Coleridge Ave
- 6225 Coleridge Ave
- 6319 Coleridge Ave
- 6223 Coleridge Ave
- 3655 Zinsle Ave
- 6321 Coleridge Ave
- 6221 Coleridge Ave
- 3651 Zinsle Ave
- 6222 Coleridge Ave
- 3650 Solar Vista Place
- 6316 Coleridge Ave
- 3648 Solar Vista Place
- 6217 Coleridge Ave
- 3703 Zinsle Ave
- 3652 Solar Vista Place
- 6401 Coleridge Ave
- 3646 Solar Vista Place
- 3660 Zinsle Ave
- 3709 Zinsle Ave
- 3645 Zinsle Ave