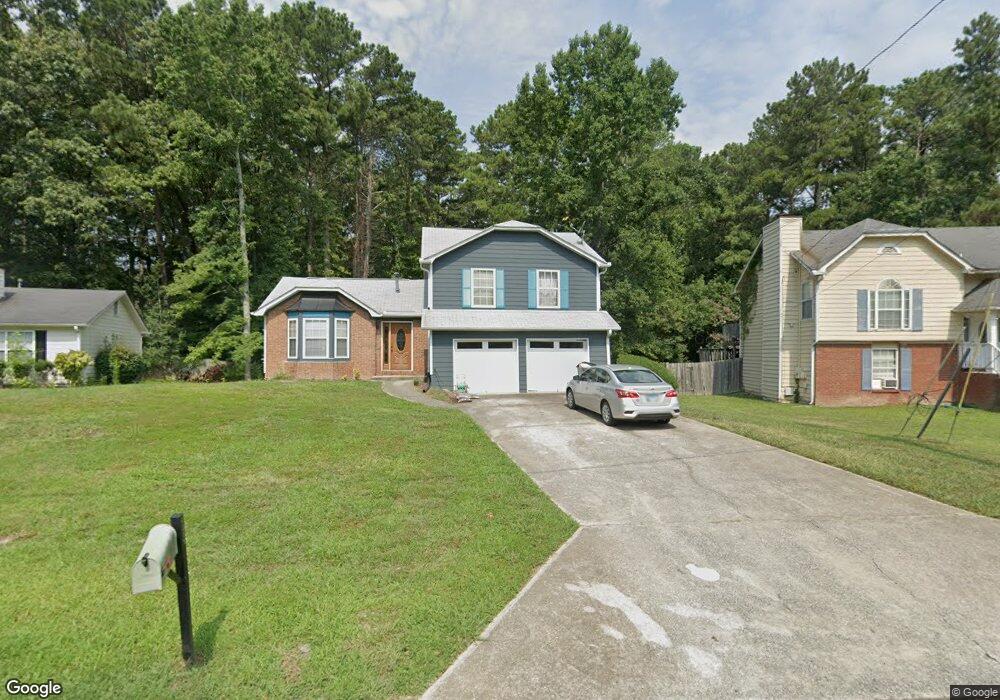
6315 Emerald Pointe Cir Atlanta, GA 30349
Estimated Value: $220,419 - $249,000
3
Beds
3
Baths
1,179
Sq Ft
$197/Sq Ft
Est. Value
About This Home
This home is located at 6315 Emerald Pointe Cir, Atlanta, GA 30349 and is currently estimated at $232,355, approximately $197 per square foot. 6315 Emerald Pointe Cir is a home located in Fulton County with nearby schools including Mcnair Middle School, Banneker High School, and Hapeville Charter Career Academy.
Ownership History
Date
Name
Owned For
Owner Type
Purchase Details
Closed on
Jul 31, 2003
Sold by
Secretary Of Hud
Bought by
Holloway Tiffany
Current Estimated Value
Home Financials for this Owner
Home Financials are based on the most recent Mortgage that was taken out on this home.
Original Mortgage
$79,920
Interest Rate
5.4%
Mortgage Type
New Conventional
Purchase Details
Closed on
Jan 7, 2003
Sold by
Chase Manhattan Mtg
Bought by
Secretary Of Hud
Purchase Details
Closed on
Jul 20, 2000
Sold by
Hall Byron S
Bought by
Golden Carla H
Home Financials for this Owner
Home Financials are based on the most recent Mortgage that was taken out on this home.
Original Mortgage
$106,482
Interest Rate
8.12%
Mortgage Type
FHA
Purchase Details
Closed on
Apr 4, 1997
Sold by
Brown Alexander X
Bought by
Johnson Sammie L
Home Financials for this Owner
Home Financials are based on the most recent Mortgage that was taken out on this home.
Original Mortgage
$91,800
Interest Rate
7.85%
Mortgage Type
New Conventional
Create a Home Valuation Report for This Property
The Home Valuation Report is an in-depth analysis detailing your home's value as well as a comparison with similar homes in the area
Home Values in the Area
Average Home Value in this Area
Purchase History
| Date | Buyer | Sale Price | Title Company |
|---|---|---|---|
| Holloway Tiffany | -- | -- | |
| Secretary Of Hud | -- | -- | |
| Chase Manhattan Mtg | $122,595 | -- | |
| Golden Carla H | $107,400 | -- | |
| Johnson Sammie L | $102,000 | -- |
Source: Public Records
Mortgage History
| Date | Status | Borrower | Loan Amount |
|---|---|---|---|
| Previous Owner | Holloway Tiffany | $79,920 | |
| Previous Owner | Golden Carla H | $106,482 | |
| Previous Owner | Johnson Sammie L | $91,800 |
Source: Public Records
Tax History Compared to Growth
Tax History
| Year | Tax Paid | Tax Assessment Tax Assessment Total Assessment is a certain percentage of the fair market value that is determined by local assessors to be the total taxable value of land and additions on the property. | Land | Improvement |
|---|---|---|---|---|
| 2025 | $1,380 | $92,120 | $19,440 | $72,680 |
| 2023 | $2,127 | $75,360 | $21,240 | $54,120 |
| 2022 | $1,277 | $50,680 | $6,360 | $44,320 |
| 2021 | $1,245 | $49,240 | $6,200 | $43,040 |
| 2020 | $1,979 | $48,640 | $6,120 | $42,520 |
| 2019 | $1,142 | $28,920 | $4,640 | $24,280 |
| 2018 | $1,126 | $28,280 | $4,560 | $23,720 |
| 2017 | $487 | $11,960 | $2,400 | $9,560 |
| 2016 | $488 | $11,960 | $2,400 | $9,560 |
| 2015 | $489 | $11,960 | $2,400 | $9,560 |
| 2014 | $516 | $11,960 | $2,400 | $9,560 |
Source: Public Records
Map
Nearby Homes
- 6305 Emerald Pointe Cir
- 2890 Kayla Ct
- 6265 Gemstone Ct
- 6037 Hemperly Rd
- 6041 Hemperly Rd
- 1005 Winter Side Ln Unit 2
- 1005 Winterside Ln
- 2970 Harper Valley Dr
- 6148 Hemperly Rd
- 2764 Ocean Valley Dr
- 0 Flat Shoals Rd Unit 10214526
- 0 Flat Shoals Rd Unit 7513975
- 6350 Kimberly Mill Rd Unit 1
- 340 Onyx Ct
- 2765 Ocean Valley Dr
- 2835 Sapphire St
- 6355 Kimberly Mill Rd
- 2802 Ocean Valley Dr
- 6278 Rockaway Rd
- 6325 Emerald Pointe Cir
- 6295 Emerald Pointe Cir
- 6335 Emerald Pointe Cir
- 6310 Emerald Pointe Cir
- 6320 Emerald Pointe Cir
- 6345 Emerald Pointe Cir Unit 131
- 6345 Emerald Pointe Cir
- 6300 Emerald Pointe Cir
- 6330 Emerald Pointe Cir
- 6285 Emerald Pointe Cir
- 6290 Emerald Pointe Cir
- 6355 Emerald Pointe Cir
- 6275 Emerald Pointe Cir
- 6340 Emerald Pointe Cir
- 270 Gemstone Place
- 2814 Flat Shoals Rd
- 6280 Emerald Pointe Cir
- 6365 Emerald Pointe Cir
- 260 Gemstone Place
- 280 Gemstone Place