U
Seller's Agent in 2012
UNREPRESENTED Properties
Unrepresented Properties
Estimated Value: $249,000 - $291,044
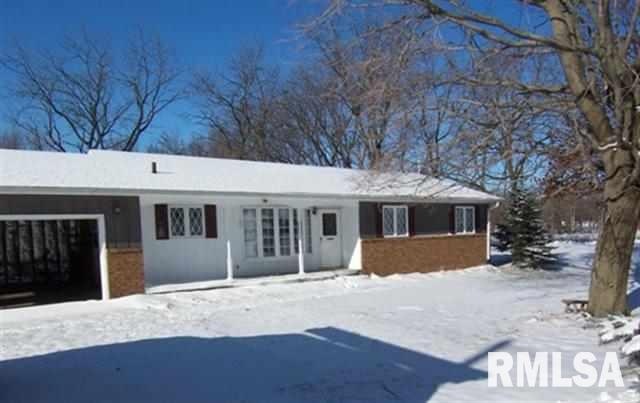
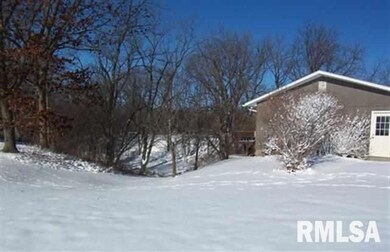
For comps only. Property was split between house lot and acreage lot and sold separately.
Last Agent to Sell the Property
UNREPRESENTED Properties
Unrepresented Properties License #0000 Listed on: 12/28/2012
Last Buyer's Agent
Bobbie Adams
Bergren Appraisal, Inc. License #S38932000/475.133841
| Date | Event | Price | List to Sale | Price per Sq Ft |
|---|---|---|---|---|
| 12/28/2012 12/28/12 | Sold | $140,000 | 0.0% | $104 / Sq Ft |
| 12/28/2012 12/28/12 | Pending | -- | -- | -- |
| 12/28/2012 12/28/12 | For Sale | $140,000 | -- | $104 / Sq Ft |
| Year | Tax Paid | Tax Assessment Tax Assessment Total Assessment is a certain percentage of the fair market value that is determined by local assessors to be the total taxable value of land and additions on the property. | Land | Improvement |
|---|---|---|---|---|
| 2024 | $5,432 | $78,131 | $20,767 | $57,364 |
| 2023 | $5,432 | $73,225 | $19,463 | $53,762 |
| 2022 | $4,638 | $64,752 | $18,562 | $46,190 |
| 2021 | $4,575 | $61,905 | $17,746 | $44,159 |
| 2020 | $4,516 | $61,110 | $17,518 | $43,592 |
| 2019 | $4,448 | $60,000 | $17,200 | $42,800 |
| 2018 | $3,842 | $52,816 | $20,275 | $32,541 |
| 2017 | $3,714 | $51,831 | $19,897 | $31,934 |
| 2016 | $3,710 | $51,573 | $19,798 | $31,775 |
| 2015 | $3,477 | $47,863 | $18,374 | $29,489 |
| 2014 | -- | $44,734 | $10,269 | $34,465 |
| 2013 | -- | $44,734 | $10,269 | $34,465 |
U
Seller's Agent in 2012
UNREPRESENTED Properties
Unrepresented Properties
B
Buyer's Agent in 2012
Bobbie Adams
Bergren Appraisal, Inc.
Source: RMLS Alliance
MLS Number: RMAQC4139763
APN: 09-01-200-005
Disclaimer: Certain information contained herein is derived from information provided by parties other than Homes.com. All information provided is deemed reliable, but is not guaranteed to be accurate and should be independently verified.
![]() IDX information is provided exclusively for personal, non-commercial use, and may not be used for any purpose other than to identify prospective properties consumers may be interested in purchasing. Information is deemed reliable but not guaranteed.
IDX information is provided exclusively for personal, non-commercial use, and may not be used for any purpose other than to identify prospective properties consumers may be interested in purchasing. Information is deemed reliable but not guaranteed.