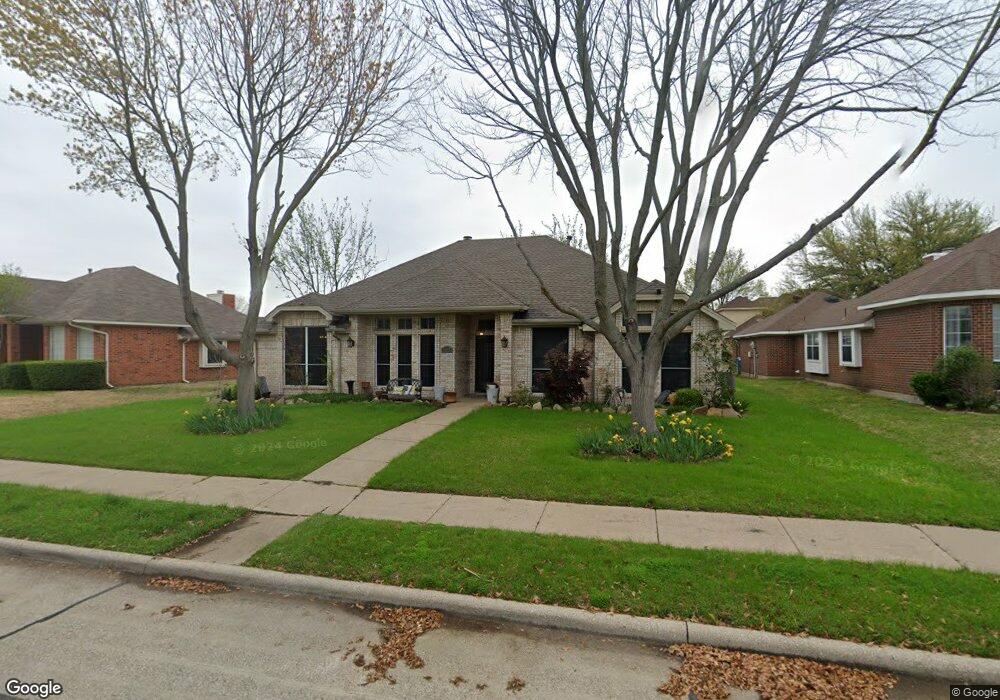
6317 Homewood Ave Rowlett, TX 75089
Springfield NeighborhoodEstimated Value: $379,786 - $407,000
4
Beds
2
Baths
2,303
Sq Ft
$169/Sq Ft
Est. Value
About This Home
This home is located at 6317 Homewood Ave, Rowlett, TX 75089 and is currently estimated at $388,947, approximately $168 per square foot. 6317 Homewood Ave is a home located in Dallas County with nearby schools including Harmony Science Academy - Garland, Harmony School of Innovation - Garland, and Wesleyan Christian Academy.
Ownership History
Date
Name
Owned For
Owner Type
Purchase Details
Closed on
Jan 28, 2008
Sold by
Va
Bought by
Hargrove Ii Dyral G and Hargrove Holly G
Current Estimated Value
Home Financials for this Owner
Home Financials are based on the most recent Mortgage that was taken out on this home.
Original Mortgage
$131,000
Outstanding Balance
$81,850
Interest Rate
5.88%
Mortgage Type
Purchase Money Mortgage
Estimated Equity
$307,097
Purchase Details
Closed on
Sep 13, 2006
Sold by
Guardian Mortgage Co Inc
Bought by
Va
Purchase Details
Closed on
Sep 6, 2006
Sold by
Hellner Robert W and Hellner Janett R
Bought by
Guardian Mortgage Co Inc
Purchase Details
Closed on
Mar 29, 2001
Sold by
Mcdade W C and Mcdade Eddie M
Bought by
Hellner Robert W and Hellner Janett R
Home Financials for this Owner
Home Financials are based on the most recent Mortgage that was taken out on this home.
Original Mortgage
$148,800
Interest Rate
6.98%
Mortgage Type
VA
Create a Home Valuation Report for This Property
The Home Valuation Report is an in-depth analysis detailing your home's value as well as a comparison with similar homes in the area
Home Values in the Area
Average Home Value in this Area
Purchase History
| Date | Buyer | Sale Price | Title Company |
|---|---|---|---|
| Hargrove Ii Dyral G | -- | Natgf | |
| Va | -- | None Available | |
| Guardian Mortgage Co Inc | $129,552 | None Available | |
| Hellner Robert W | -- | -- |
Source: Public Records
Mortgage History
| Date | Status | Borrower | Loan Amount |
|---|---|---|---|
| Open | Hargrove Ii Dyral G | $131,000 | |
| Previous Owner | Hellner Robert W | $148,800 |
Source: Public Records
Tax History Compared to Growth
Tax History
| Year | Tax Paid | Tax Assessment Tax Assessment Total Assessment is a certain percentage of the fair market value that is determined by local assessors to be the total taxable value of land and additions on the property. | Land | Improvement |
|---|---|---|---|---|
| 2025 | $6,442 | $387,120 | $70,000 | $317,120 |
| 2024 | $6,442 | $387,120 | $70,000 | $317,120 |
| 2023 | $6,442 | $358,350 | $70,000 | $288,350 |
| 2022 | $8,683 | $358,350 | $70,000 | $288,350 |
| 2021 | $6,592 | $251,810 | $55,000 | $196,810 |
| 2020 | $6,651 | $251,810 | $55,000 | $196,810 |
| 2019 | $7,236 | $251,810 | $55,000 | $196,810 |
| 2018 | $6,431 | $222,240 | $30,000 | $192,240 |
| 2017 | $6,449 | $222,240 | $30,000 | $192,240 |
| 2016 | $5,269 | $181,570 | $30,000 | $151,570 |
| 2015 | $3,515 | $145,530 | $26,000 | $119,530 |
| 2014 | $3,515 | $145,530 | $26,000 | $119,530 |
Source: Public Records
Map
Nearby Homes
- 6306 Debbie Cir
- 6617 Stamps St
- 6718 Livingstone St
- 6110 Tacoma St
- 6913 Brandford Rd
- 7005 Buckhorn Dr
- 7013 Tremont Ln
- 6317 Locust St
- 2001 Maggis Meadow Ln
- 2601 Daisy Ln
- 6407 Redwood Ln
- 2221 Petunia Ln
- 1709 Northampton Dr
- 3422 Jonquil Ln
- 6605 Bluebonnet Dr
- 2710 Roughleaf Ln
- 6518 Teresa Ln
- 3510 Jonquil Ln
- 7202 Sand Pine Dr
- 2314 Marigold Dr
- 6401 Homewood Ave
- 6313 Homewood Ave
- 6318 Debbie Cir
- 6405 Homewood Ave
- 6314 Debbie Cir
- 6309 Homewood Ave
- 6402 Debbie Cir
- 6318 Homewood Ave
- 6314 Homewood Ave
- 6406 Debbie Cir
- 6310 Debbie Cir
- 6406 Homewood Ave
- 6310 Homewood Ave
- 6409 Homewood Ave
- 6410 Debbie Cir
- 6410 Homewood Ave
- 6317 Debbie Cir
- 6317 Madison Ave
- 6301 Homewood Ave
- 6313 Madison Ave