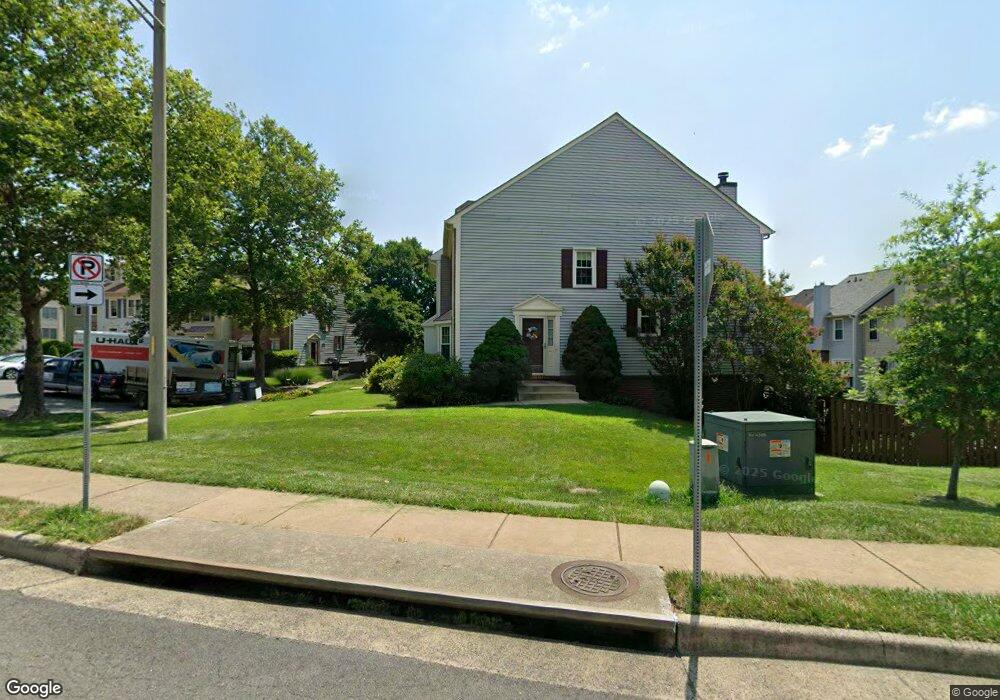
6317 Trevilian Place Centreville, VA 20121
Estimated Value: $573,727 - $650,000
3
Beds
4
Baths
1,456
Sq Ft
$410/Sq Ft
Est. Value
About This Home
This home is located at 6317 Trevilian Place, Centreville, VA 20121 and is currently estimated at $597,432, approximately $410 per square foot. 6317 Trevilian Place is a home located in Fairfax County with nearby schools including Centreville Elementary School, Liberty Middle School, and Centreville High School.
Ownership History
Date
Name
Owned For
Owner Type
Purchase Details
Closed on
May 19, 2025
Sold by
Phan Evelyn T
Bought by
Phan Evelyn T and Evelyn T Phan Trust
Current Estimated Value
Purchase Details
Closed on
Dec 11, 2020
Sold by
Nguyen Hoi and Phan Evelyn T
Bought by
Phan Evelyn T
Home Financials for this Owner
Home Financials are based on the most recent Mortgage that was taken out on this home.
Original Mortgage
$230,000
Interest Rate
2.7%
Mortgage Type
New Conventional
Purchase Details
Closed on
Aug 4, 1998
Sold by
Hoppe Arthur J
Bought by
Nguyen Hoi
Home Financials for this Owner
Home Financials are based on the most recent Mortgage that was taken out on this home.
Original Mortgage
$128,000
Interest Rate
6.92%
Create a Home Valuation Report for This Property
The Home Valuation Report is an in-depth analysis detailing your home's value as well as a comparison with similar homes in the area
Home Values in the Area
Average Home Value in this Area
Purchase History
| Date | Buyer | Sale Price | Title Company |
|---|---|---|---|
| Phan Evelyn T | -- | None Listed On Document | |
| Phan Evelyn T | -- | Elite Title & Escrow Llc | |
| Nguyen Hoi | $142,000 | -- |
Source: Public Records
Mortgage History
| Date | Status | Borrower | Loan Amount |
|---|---|---|---|
| Previous Owner | Phan Evelyn T | $230,000 | |
| Previous Owner | Nguyen Hoi | $128,000 |
Source: Public Records
Tax History Compared to Growth
Tax History
| Year | Tax Paid | Tax Assessment Tax Assessment Total Assessment is a certain percentage of the fair market value that is determined by local assessors to be the total taxable value of land and additions on the property. | Land | Improvement |
|---|---|---|---|---|
| 2025 | $5,785 | $560,590 | $175,000 | $385,590 |
| 2024 | $5,785 | $499,330 | $145,000 | $354,330 |
| 2023 | $5,559 | $492,580 | $145,000 | $347,580 |
| 2022 | $5,188 | $453,710 | $135,000 | $318,710 |
| 2021 | $4,736 | $403,610 | $120,000 | $283,610 |
| 2020 | $4,670 | $394,550 | $115,000 | $279,550 |
| 2019 | $4,465 | $377,240 | $105,000 | $272,240 |
| 2018 | $4,281 | $372,220 | $105,000 | $267,220 |
| 2017 | $4,025 | $346,660 | $92,000 | $254,660 |
| 2016 | $3,923 | $338,600 | $87,000 | $251,600 |
| 2015 | $3,779 | $338,600 | $87,000 | $251,600 |
| 2014 | $3,552 | $319,030 | $82,000 | $237,030 |
Source: Public Records
Map
Nearby Homes
- 6309 Trevilian Place
- 6311 Betsy Ross Ct
- 6316 Mary Todd Ln
- 14005C Grumble Jones Ct
- 14079 Red River Dr
- 14000 Grumble Jones Ct Unit B
- 13906 Big Yankee Ln
- 14102 Autumn Cir
- 13875 Laura Ratcliff Ct
- 14146 Red River Dr
- 14158 Darkwood Cir
- 14002C Walter Bowie Ln
- 14159 Autumn Cir
- 13975 Tanners House Way
- 6488 Palisades Dr
- 6080 Deer Hill Ct
- 6218 Stonehunt Place
- 14087 Asher View
- 5936 Spruce Run Ct
- 6605 English Saddle Ct
- 6315 Trevilian Place
- 6313 Trevilian Place
- 6311 Trevilian Place
- 13920 Ludington Place
- 13922 Ludington Place
- 13918 Ludington Place
- 13916 Ludington Place
- 6307 Trevilian Place
- 13914 Ludington Place
- 6305 Trevilian Place
- 13912 Ludington Place
- 6303 Trevilian Place
- 6301 Trevilian Place
- 13967 Lightburn Ln
- 13910 Ludington Place
- 13965 Lightburn Ln
- 13908 Ludington Place
- 13963 Lightburn Ln
- 13961 Lightburn Ln
- 14015 Betsy Ross Ln