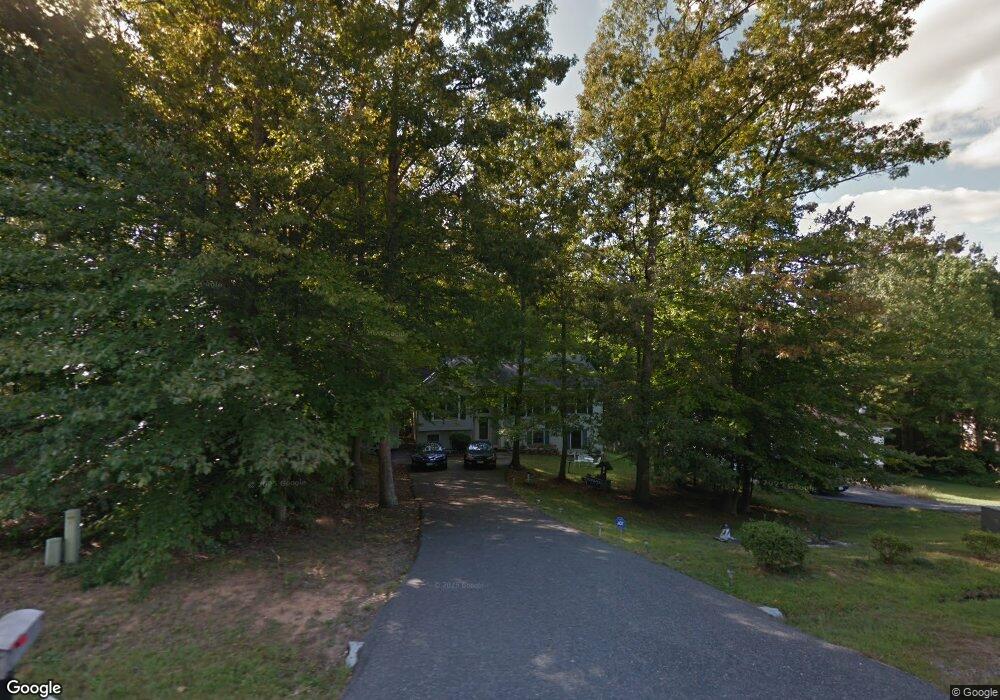
6318 Plantation Forest Dr Spotsylvania, VA 22553
Spotsylvania Courthouse NeighborhoodEstimated Value: $378,000 - $411,345
4
Beds
3
Baths
1,144
Sq Ft
$348/Sq Ft
Est. Value
About This Home
This home is located at 6318 Plantation Forest Dr, Spotsylvania, VA 22553 and is currently estimated at $397,586, approximately $347 per square foot. 6318 Plantation Forest Dr is a home located in Spotsylvania County with nearby schools including Courtland Elementary School, Spotsylvania Middle School, and Courtland High School.
Ownership History
Date
Name
Owned For
Owner Type
Purchase Details
Closed on
Aug 1, 2023
Sold by
Ford James E and Ford Irma V
Bought by
Powers Andrew J
Current Estimated Value
Home Financials for this Owner
Home Financials are based on the most recent Mortgage that was taken out on this home.
Original Mortgage
$255,200
Outstanding Balance
$249,254
Interest Rate
6.69%
Mortgage Type
New Conventional
Estimated Equity
$148,332
Purchase Details
Closed on
Jan 26, 2017
Sold by
Ford James E and Wright-Ford Irma V
Bought by
Ford James E and Wright-Ford Irma V
Home Financials for this Owner
Home Financials are based on the most recent Mortgage that was taken out on this home.
Original Mortgage
$186,917
Interest Rate
4.32%
Mortgage Type
New Conventional
Purchase Details
Closed on
Jun 29, 2004
Sold by
Cannon Robert
Bought by
Ford James
Home Financials for this Owner
Home Financials are based on the most recent Mortgage that was taken out on this home.
Original Mortgage
$234,000
Interest Rate
6.3%
Mortgage Type
VA
Create a Home Valuation Report for This Property
The Home Valuation Report is an in-depth analysis detailing your home's value as well as a comparison with similar homes in the area
Home Values in the Area
Average Home Value in this Area
Purchase History
| Date | Buyer | Sale Price | Title Company |
|---|---|---|---|
| Powers Andrew J | $319,000 | Alford Title | |
| Ford James E | -- | None Available | |
| Ford James | $234,000 | -- |
Source: Public Records
Mortgage History
| Date | Status | Borrower | Loan Amount |
|---|---|---|---|
| Open | Powers Andrew J | $255,200 | |
| Previous Owner | Ford James E | $186,917 | |
| Previous Owner | Ford James | $234,000 |
Source: Public Records
Tax History Compared to Growth
Tax History
| Year | Tax Paid | Tax Assessment Tax Assessment Total Assessment is a certain percentage of the fair market value that is determined by local assessors to be the total taxable value of land and additions on the property. | Land | Improvement |
|---|---|---|---|---|
| 2025 | $2,601 | $354,200 | $120,000 | $234,200 |
| 2024 | $2,601 | $354,200 | $120,000 | $234,200 |
| 2023 | $2,149 | $278,500 | $105,000 | $173,500 |
| 2022 | $2,054 | $278,500 | $105,000 | $173,500 |
| 2021 | $1,995 | $246,500 | $85,000 | $161,500 |
| 2020 | $1,995 | $246,500 | $85,000 | $161,500 |
| 2019 | $1,878 | $221,600 | $70,000 | $151,600 |
| 2018 | $1,846 | $221,600 | $70,000 | $151,600 |
| 2017 | $9 | $192,300 | $50,000 | $142,300 |
| 2016 | $14 | $192,300 | $50,000 | $142,300 |
| 2015 | -- | $182,300 | $42,500 | $139,800 |
| 2014 | -- | $182,300 | $42,500 | $139,800 |
Source: Public Records
Map
Nearby Homes
- 6317 Plantation Forest Dr
- 8734 Greenway Dr
- 8718 Stevenson Ln
- 8809 Stevenson Ln
- 10304 Bayberry Ln
- 8611 Upton Ln
- Aria Plan at Courthouse Commons Townhomes
- Ballad Plan at Courthouse Commons Townhomes
- Cadence Plan at Courthouse Commons Townhomes
- 8404 Devries Ln
- 8639 Rosecrans Ln
- 6501 Crittenden Ln
- 10622 Mockingbird Ln
- 10811 Honorable Ct
- 8916 Courthouse Rd
- 7947 Independence Dr
- 9409 Everette Ct
- 404 Pool Dr
- 415 Cooper St
- 6114 Massaponax Church Rd
- 6320 Plantation Forest Dr
- 6316 Plantation Forest Dr
- 6322 Plantation Forest Dr
- 6314 Plantation Forest Dr
- 6319 Plantation Forest Dr
- 6324 Plantation Forest Dr Unit 303
- 6312 Plantation Forest Dr
- 6321 Plantation Forest Dr
- 6323 Plantation Forest Dr
- 6315 Plantation Forest Dr
- 6326 Plantation Forest Dr
- 6310 Plantation Forest Dr
- 6325 Plantation Forest Dr
- 6313 Plantation Forest Dr
- 6328 Plantation Forest Dr
- 8714 Greenway Dr
- 6327 Plantation Forest Dr
- 8712 Greenway Dr
- 6311 Plantation Forest Dr
- 8716 Greenway Dr