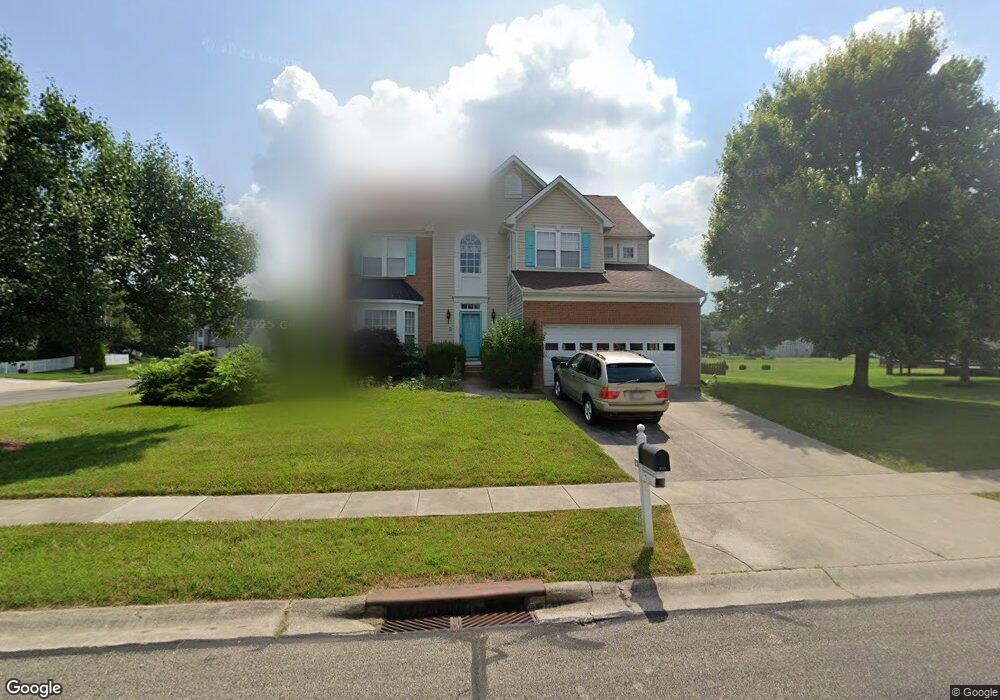
6318 Riverbend Dr Dayton, OH 45415
Estimated Value: $299,952 - $369,000
3
Beds
3
Baths
2,322
Sq Ft
$144/Sq Ft
Est. Value
About This Home
This home is located at 6318 Riverbend Dr, Dayton, OH 45415 and is currently estimated at $335,238, approximately $144 per square foot. 6318 Riverbend Dr is a home located in Montgomery County with nearby schools including Helke Elementary School, Morton Middle School, and Butler High School.
Ownership History
Date
Name
Owned For
Owner Type
Purchase Details
Closed on
Jun 27, 2007
Sold by
Hanley Jonathan J and Hanley Denise K
Bought by
Robinson Jeanette
Current Estimated Value
Home Financials for this Owner
Home Financials are based on the most recent Mortgage that was taken out on this home.
Original Mortgage
$160,000
Outstanding Balance
$100,214
Interest Rate
6.54%
Mortgage Type
Purchase Money Mortgage
Estimated Equity
$235,024
Purchase Details
Closed on
Nov 14, 2003
Sold by
Dubose Model Home Investments 108
Bought by
Hanley Jonathan J and Hanley Denise K
Home Financials for this Owner
Home Financials are based on the most recent Mortgage that was taken out on this home.
Original Mortgage
$169,000
Interest Rate
4.87%
Mortgage Type
Purchase Money Mortgage
Purchase Details
Closed on
Sep 17, 1999
Sold by
Riverbend Meadows Development Co Ltd
Bought by
Nvr Inc
Create a Home Valuation Report for This Property
The Home Valuation Report is an in-depth analysis detailing your home's value as well as a comparison with similar homes in the area
Home Values in the Area
Average Home Value in this Area
Purchase History
| Date | Buyer | Sale Price | Title Company |
|---|---|---|---|
| Robinson Jeanette | $200,000 | Evans Title Agency Inc | |
| Hanley Jonathan J | $239,000 | -- | |
| Nvr Inc | $32,900 | -- |
Source: Public Records
Mortgage History
| Date | Status | Borrower | Loan Amount |
|---|---|---|---|
| Open | Robinson Jeanette | $160,000 | |
| Previous Owner | Hanley Jonathan J | $169,000 |
Source: Public Records
Tax History Compared to Growth
Tax History
| Year | Tax Paid | Tax Assessment Tax Assessment Total Assessment is a certain percentage of the fair market value that is determined by local assessors to be the total taxable value of land and additions on the property. | Land | Improvement |
|---|---|---|---|---|
| 2024 | $4,662 | $77,650 | $14,950 | $62,700 |
| 2023 | $4,662 | $77,650 | $14,950 | $62,700 |
| 2022 | $4,992 | $63,790 | $12,250 | $51,540 |
| 2021 | $5,006 | $63,790 | $12,250 | $51,540 |
| 2020 | $5,003 | $63,790 | $12,250 | $51,540 |
| 2019 | $5,098 | $58,580 | $12,250 | $46,330 |
| 2018 | $5,112 | $58,580 | $12,250 | $46,330 |
| 2017 | $5,082 | $58,580 | $12,250 | $46,330 |
| 2016 | $5,156 | $58,190 | $12,250 | $45,940 |
| 2015 | $4,754 | $58,190 | $12,250 | $45,940 |
| 2014 | $4,754 | $58,190 | $12,250 | $45,940 |
| 2012 | -- | $55,060 | $14,000 | $41,060 |
Source: Public Records
Map
Nearby Homes
- 701 Fredericksburg Dr
- 270 Pamela Ave
- 8090 Dog Leg Rd
- 159 Burgess Ave
- 6552 Stillcrest Way
- 5653 Philadelphia Dr
- 6029 Imperial Hills Dr
- 6012 Imperial Hills Dr
- 5563 Fair Valley Rd
- 6810 Trailview Dr
- 455 Shiloh Dr
- 5473 Fair Valley Rd
- 7042 Society Ct
- 266 Briarcliff Rd
- 5129 Rivers Edge Blvd
- 6430 Oakhurst Place
- 2625 Secretariat Ct
- 7725 Harrington Ave
- 0 Tall Hickory Trail
- 7935 Harrington Ave
- 1408 Scenic River Dr
- 1301 Stillwater Ln
- 6309 Riverbend Dr
- 1401 Scenic River Dr
- 6321 Riverbend Dr
- 1416 Scenic River Dr
- 1311 Stillwater Ln
- 6331 Riverbend Dr
- 1421 Scenic River Dr
- 6341 Riverbend Dr
- 6344 Riverbend Dr
- 1424 Scenic River Dr
- 6538 Riverbend Dr
- 1441 Scenic River Dr
- 1321 Stillwater Ln
- 1432 Scenic River Dr
- 6354 Riverbend Dr
- 1449 Scenic River Dr
- 6639 Riverbend Dr
- 1341 Stillwater Ln