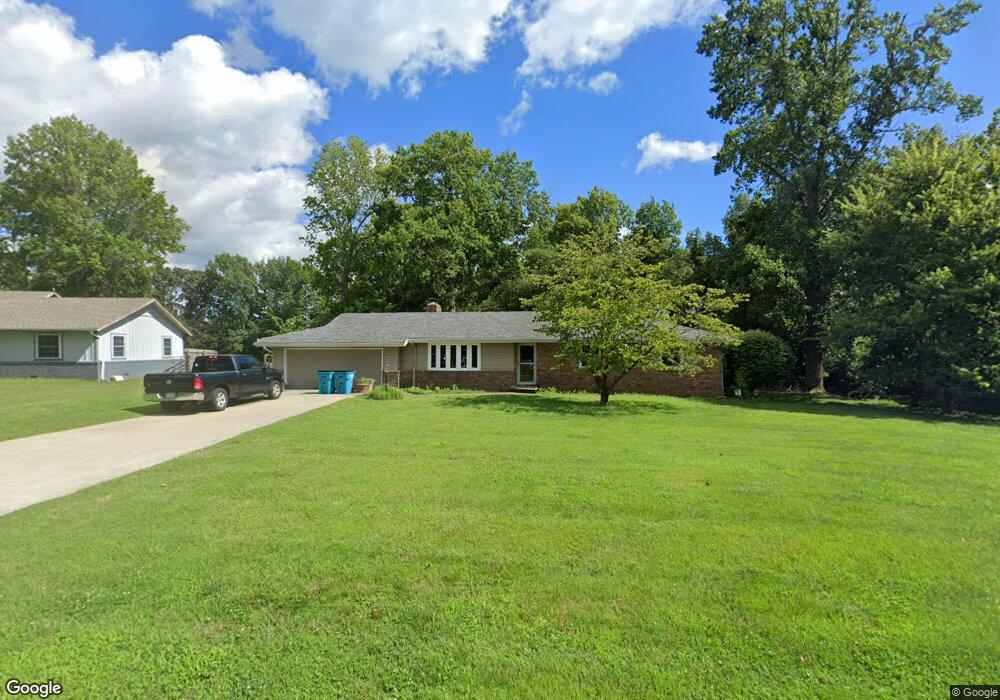
6318 S Glenridge Dr Springfield, MO 65804
Southwest Springfield NeighborhoodEstimated Value: $395,000 - $477,000
3
Beds
2
Baths
2,482
Sq Ft
$169/Sq Ft
Est. Value
About This Home
This home is located at 6318 S Glenridge Dr, Springfield, MO 65804 and is currently estimated at $419,241, approximately $168 per square foot. 6318 S Glenridge Dr is a home located in Greene County with nearby schools including Walt Disney Elementary School, Cherokee Middle School, and Kickapoo High School.
Ownership History
Date
Name
Owned For
Owner Type
Purchase Details
Closed on
Jun 29, 2022
Sold by
Massey Revocable Qualified Spousal Trust
Bought by
Joyce Joy L
Current Estimated Value
Purchase Details
Closed on
Apr 19, 2018
Sold by
Massey Carol L
Bought by
Massey Carol L
Home Financials for this Owner
Home Financials are based on the most recent Mortgage that was taken out on this home.
Original Mortgage
$100,000
Interest Rate
4.44%
Mortgage Type
New Conventional
Purchase Details
Closed on
Apr 9, 2018
Sold by
Massey Carol
Bought by
Massey Carol L and The Massey Revocable Qualified
Home Financials for this Owner
Home Financials are based on the most recent Mortgage that was taken out on this home.
Original Mortgage
$100,000
Interest Rate
4.44%
Mortgage Type
New Conventional
Purchase Details
Closed on
Apr 17, 2014
Sold by
Massey James A and Massey Carol L
Bought by
Massey Revocable Qualified Spousal Trust and Massey Carol L
Create a Home Valuation Report for This Property
The Home Valuation Report is an in-depth analysis detailing your home's value as well as a comparison with similar homes in the area
Home Values in the Area
Average Home Value in this Area
Purchase History
| Date | Buyer | Sale Price | Title Company |
|---|---|---|---|
| Joyce Joy L | -- | None Listed On Document | |
| Massey Carol L | -- | None Available | |
| Massey Carol L | -- | None Available | |
| Massey Revocable Qualified Spousal Trust | -- | None Available |
Source: Public Records
Mortgage History
| Date | Status | Borrower | Loan Amount |
|---|---|---|---|
| Previous Owner | Massey Carol L | $100,000 |
Source: Public Records
Tax History Compared to Growth
Tax History
| Year | Tax Paid | Tax Assessment Tax Assessment Total Assessment is a certain percentage of the fair market value that is determined by local assessors to be the total taxable value of land and additions on the property. | Land | Improvement |
|---|---|---|---|---|
| 2025 | $1,861 | $40,450 | $9,310 | $31,140 |
| 2024 | $1,861 | $33,610 | $11,890 | $21,720 |
| 2023 | $1,852 | $33,610 | $11,890 | $21,720 |
| 2022 | $1,621 | $30,170 | $11,890 | $18,280 |
| 2021 | $1,621 | $30,170 | $11,890 | $18,280 |
| 2020 | $1,689 | $29,810 | $11,890 | $17,920 |
| 2019 | $1,641 | $29,810 | $11,890 | $17,920 |
| 2018 | $1,577 | $28,590 | $11,890 | $16,700 |
| 2017 | $1,562 | $28,590 | $11,890 | $16,700 |
| 2016 | $1,562 | $28,590 | $11,890 | $16,700 |
| 2015 | $1,550 | $28,590 | $11,890 | $16,700 |
| 2014 | $1,562 | $28,590 | $11,890 | $16,700 |
Source: Public Records
Map
Nearby Homes
- 6266 S Farm Road 163
- 6147 S Hampton Ave
- 6165 S Maryland Ave
- 6008 S Mccann Ave
- 6038 S Maryland Ave
- 1414 E Wilder Dr
- 6053 S Maryland Ave
- 6006 S Maryland Ave
- 6195 S Dollison Ave
- 1362 E Siler Pkwy
- 1077 E Siler Pkwy
- 1049 E Siler Pkwy
- Lot 28 S Dollison
- Lot 29 S Dollison
- Lots 19 E Siler Pkwy
- Lots 1 E Siler Pkwy
- Lot 4 S Dollison
- Lot 38 S Holland Ave
- 5980 S Dollison Ave
- Lot 35 S Holland Ave
- 6308 S Glenridge Dr
- 6330 S Glenridge Dr
- 6319 S White Hills Dr
- 6317 S Glenridge Dr
- 6264 S Glenridge Dr
- 6348 S Glenridge Dr
- 6261 S Glenridge Dr
- 6331 S Glenridge Dr
- 6250 S Glenridge Dr
- 6341 S Glenridge Dr
- 6252 S Philmar Dr
- 6239 S Glenridge Dr
- 6371 S Glenridge Dr
- 6361 S Glenridge Dr
- 6240 S Glenridge Dr
- 6369 S Glenridge Dr
- 1230 E River Rd
- 1348 E River Rd
- 6264 S White Hills Dr
- 1255 E River Rd