Estimated Value: $682,930 - $836,000
4
Beds
4
Baths
2,988
Sq Ft
$254/Sq Ft
Est. Value
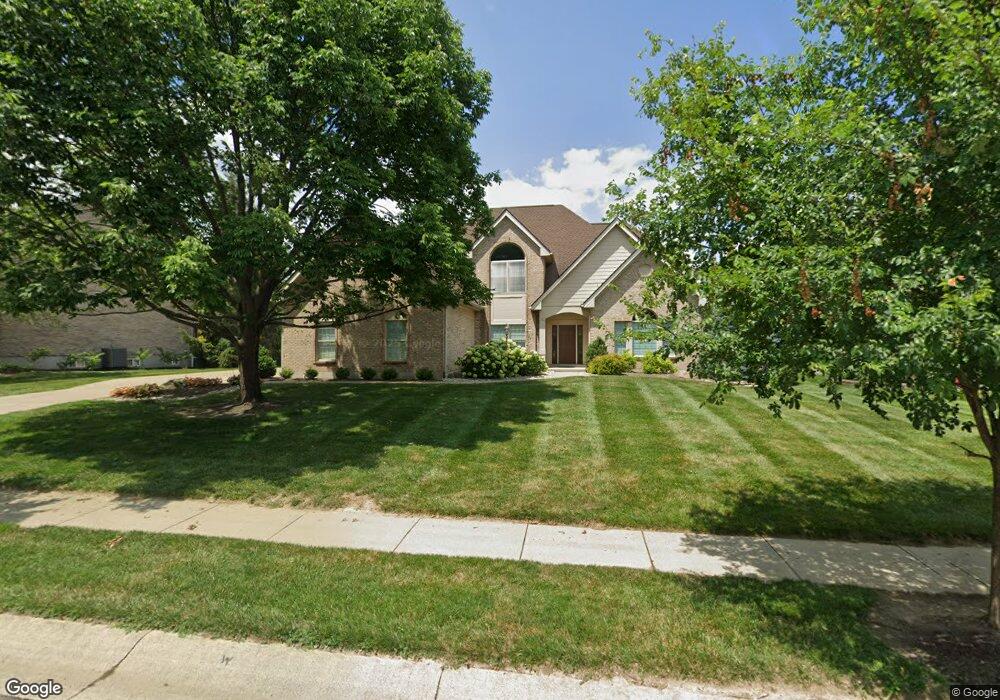
About This Home
This home is located at 6318 Tarton Fields Ln, Mason, OH 45040 and is currently estimated at $758,233, approximately $253 per square foot. 6318 Tarton Fields Ln is a home located in Warren County with nearby schools including Mason Intermediate Elementary School, Mason Middle School, and William Mason High School.
Ownership History
Date
Name
Owned For
Owner Type
Purchase Details
Closed on
Aug 7, 2018
Sold by
Gale Bonnie L and Gale William C
Bought by
Gale Brian Thomas and Gale Adam Douglas
Current Estimated Value
Purchase Details
Closed on
Aug 9, 2011
Sold by
Gale William C and Gale Bonnie L
Bought by
Gale Bonnie L
Purchase Details
Closed on
Jul 30, 2004
Sold by
Cochran Robert G and Cochran Linda P
Bought by
Gale William C and Gale Bonnie L
Purchase Details
Closed on
Sep 3, 1997
Sold by
Mason Joint Venture Pll
Bought by
Cochran Robert G and Cochran Linda P
Home Financials for this Owner
Home Financials are based on the most recent Mortgage that was taken out on this home.
Original Mortgage
$214,600
Interest Rate
6.99%
Mortgage Type
New Conventional
Create a Home Valuation Report for This Property
The Home Valuation Report is an in-depth analysis detailing your home's value as well as a comparison with similar homes in the area
Home Values in the Area
Average Home Value in this Area
Purchase History
| Date | Buyer | Sale Price | Title Company |
|---|---|---|---|
| Gale Brian Thomas | -- | None Available | |
| Gale William C | -- | None Available | |
| Gale Bonnie L | -- | Riverbend Commercial Title L | |
| Gale William C | $447,500 | Riverbend Title Agency | |
| Cochran Robert G | $89,900 | -- |
Source: Public Records
Mortgage History
| Date | Status | Borrower | Loan Amount |
|---|---|---|---|
| Previous Owner | Cochran Robert G | $214,600 |
Source: Public Records
Tax History
| Year | Tax Paid | Tax Assessment Tax Assessment Total Assessment is a certain percentage of the fair market value that is determined by local assessors to be the total taxable value of land and additions on the property. | Land | Improvement |
|---|---|---|---|---|
| 2025 | $8,054 | $198,450 | $36,230 | $162,220 |
| 2024 | $8,054 | $198,450 | $36,230 | $162,220 |
| 2023 | $7,823 | $162,848 | $34,650 | $128,198 |
| 2022 | $7,722 | $162,848 | $34,650 | $128,198 |
| 2021 | $7,315 | $162,848 | $34,650 | $128,198 |
| 2020 | $3,878 | $148,043 | $31,500 | $116,543 |
| 2019 | $7,130 | $148,043 | $31,500 | $116,543 |
| 2018 | $7,154 | $148,043 | $31,500 | $116,543 |
| 2017 | $7,023 | $135,674 | $29,323 | $106,351 |
| 2016 | $7,234 | $135,674 | $29,323 | $106,351 |
| 2015 | $7,249 | $135,674 | $29,323 | $106,351 |
| 2014 | $7,266 | $126,800 | $27,410 | $99,390 |
| 2013 | $7,282 | $145,740 | $31,500 | $114,240 |
Source: Public Records
Map
Nearby Homes
- 3856 Sandtrap Cir
- 5921 Fairway Dr
- 6416 Eagleview Dr
- 4109 Old Manchester Ct
- 602 Bunker Ln
- 4019 Fieldsedge Dr
- 3634 Pebble Creek Ct
- 618 Bunker Ln
- 4202 E Village Dr
- 6764 Pondfield Ln
- 6768 Pondfield Ln Unit 271E
- 382 Walnut Ln
- 6510 Prestwick Ct
- 6674 Villager Place Unit 153D
- 5873 Falling Brook Dr
- 5399 Country Ridge Dr
- 220 Kings Mills Rd
- 7119 White Oak Ct
- 7149 White Oak Ct Unit 14B
- 5533 Cox-Smith Rd
- 6324 Tarton Fields Ln
- 6308 Tarton Fields Ln
- 6294 Tarton Fields Ln
- 6330 Tarton Fields Ln
- 6317 Tarton Fields Ln
- 6323 Tarton Fields Ln
- 6309 Tarton Fields Ln
- 6336 Tarton Fields Ln
- 6305 Tarton Fields Ln
- 6329 Tarton Fields Ln
- 6299 Tarton Fields Ln
- 4013 Royal Dornoch Ln
- 3965 Saint Andrews Ct
- 3979 Saint Andrews Ct
- 6335 Tarton Fields Ln
- 3953 St Andrews Ct
- 3953 Saint Andrews Ct
- 3979 St Andrews Ct
- 6344 Tarton Fields Ln
- 6274 Tarton Fields Ln
Your Personal Tour Guide
Ask me questions while you tour the home.