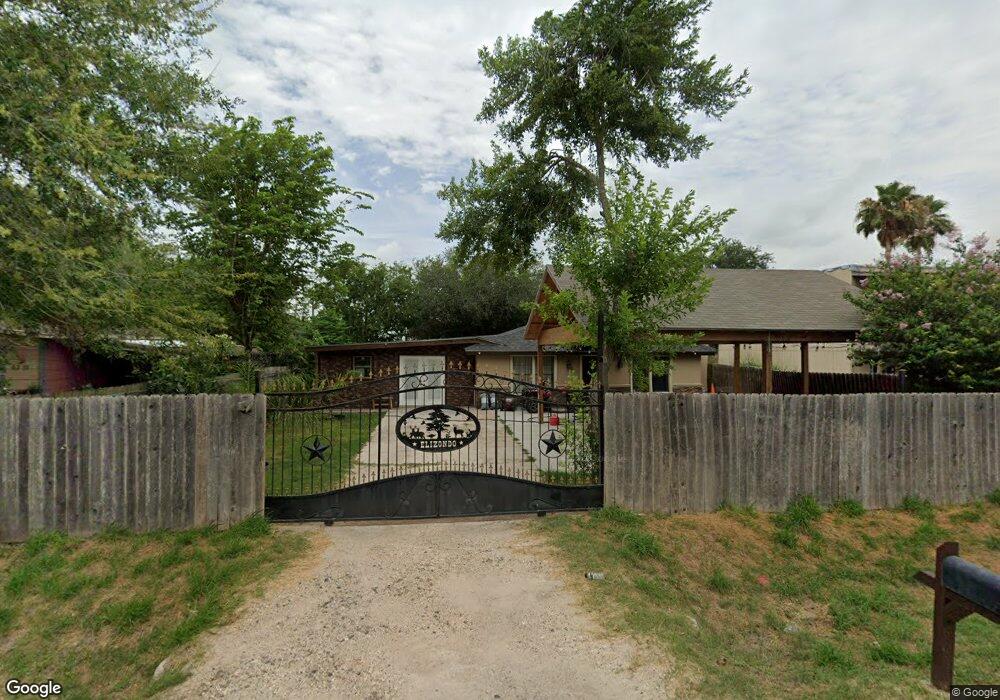
6319 D St Mercedes, TX 78570
Estimated Value: $100,000 - $170,000
2
Beds
1
Bath
864
Sq Ft
$149/Sq Ft
Est. Value
About This Home
This home is located at 6319 D St, Mercedes, TX 78570 and is currently estimated at $128,638, approximately $148 per square foot. 6319 D St is a home located in Hidalgo County with nearby schools including North Bridge Elementary School, Mary Hoge Middle School, and Weslaco East High School.
Ownership History
Date
Name
Owned For
Owner Type
Purchase Details
Closed on
Apr 29, 2010
Sold by
The Secretary Of Housing & Urban Develop
Bought by
Aza Rafaela
Current Estimated Value
Purchase Details
Closed on
Apr 10, 2009
Sold by
Everbank
Bought by
The Secretary Of Housing & Urban Develop
Purchase Details
Closed on
Apr 7, 2009
Sold by
Dela Cruz Sergio and De La Cruz Nereida
Bought by
Everbank
Purchase Details
Closed on
May 27, 1998
Sold by
Martinez Victoria and Martinez Pedro
Bought by
Delacruz Sergio and Delacruz Nereida
Home Financials for this Owner
Home Financials are based on the most recent Mortgage that was taken out on this home.
Original Mortgage
$35,327
Interest Rate
7.08%
Mortgage Type
FHA
Purchase Details
Closed on
Oct 7, 1997
Sold by
Olivarez L C
Bought by
Martinez Victoriana
Create a Home Valuation Report for This Property
The Home Valuation Report is an in-depth analysis detailing your home's value as well as a comparison with similar homes in the area
Home Values in the Area
Average Home Value in this Area
Purchase History
| Date | Buyer | Sale Price | Title Company |
|---|---|---|---|
| Aza Rafaela | -- | None Available | |
| The Secretary Of Housing & Urban Develop | -- | None Available | |
| Everbank | $36,367 | None Available | |
| Delacruz Sergio | -- | -- | |
| Martinez Victoriana | -- | -- |
Source: Public Records
Mortgage History
| Date | Status | Borrower | Loan Amount |
|---|---|---|---|
| Previous Owner | Delacruz Sergio | $35,327 |
Source: Public Records
Tax History Compared to Growth
Tax History
| Year | Tax Paid | Tax Assessment Tax Assessment Total Assessment is a certain percentage of the fair market value that is determined by local assessors to be the total taxable value of land and additions on the property. | Land | Improvement |
|---|---|---|---|---|
| 2025 | $1,563 | $88,423 | $39,498 | $48,925 |
| 2024 | $1,563 | $83,452 | $39,498 | $43,954 |
| 2023 | $1,550 | $83,452 | $39,498 | $43,954 |
| 2022 | $889 | $47,247 | $12,939 | $34,308 |
| 2021 | $786 | $40,893 | $12,939 | $27,954 |
| 2020 | $732 | $36,774 | $12,939 | $23,835 |
| 2019 | $641 | $30,815 | $12,939 | $17,876 |
| 2018 | $651 | $31,213 | $12,939 | $18,274 |
| 2017 | $682 | $32,802 | $12,939 | $19,863 |
| 2016 | $591 | $28,405 | $10,896 | $17,509 |
| 2015 | $592 | $29,928 | $10,896 | $19,032 |
Source: Public Records
Map
Nearby Homes
- 3120 Rosa St
- 3 E St
- Mile 3 E St
- 3109 Raul Gonzalez Dr
- 6714 E St
- 6020 A St
- 00 N Mile 3 1 2 Rd W
- 3027 E Mile 11 N
- 1415 Petri Dr
- 5424 Tyler St
- 1015 E Mile 11 N
- 5263 Tyler St
- 7716 Yvette Cir
- 0000 S Jesus Flores Rd S
- 0000 E Mile 12 Hwy E
- 7109 Victor Ave
- 4614 Devon St
- 1433 E Mile 11 N
- 3510 Abbey St
- 4712 Comanche Dr