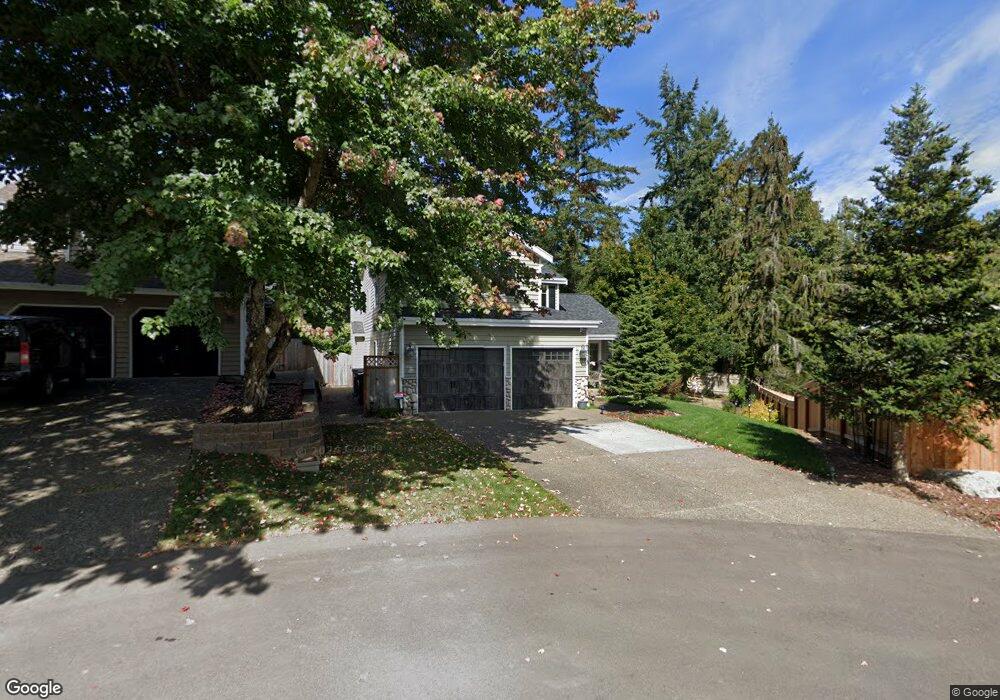
6319 Greengate Place SE Port Orchard, WA 98367
Bethel NeighborhoodEstimated Value: $541,925 - $632,000
3
Beds
3
Baths
2,130
Sq Ft
$267/Sq Ft
Est. Value
About This Home
This home is located at 6319 Greengate Place SE, Port Orchard, WA 98367 and is currently estimated at $569,481, approximately $267 per square foot. 6319 Greengate Place SE is a home located in Kitsap County with nearby schools including Hidden Creek Elementary School, Marcus Whitman Middle School, and South Kitsap High School.
Ownership History
Date
Name
Owned For
Owner Type
Purchase Details
Closed on
Dec 10, 2002
Sold by
Landowski Richard and Landowski Mary Anne E
Bought by
Gallagher Robert E and Gallagher Susan Denise
Current Estimated Value
Home Financials for this Owner
Home Financials are based on the most recent Mortgage that was taken out on this home.
Original Mortgage
$177,461
Outstanding Balance
$75,240
Interest Rate
6.06%
Mortgage Type
Purchase Money Mortgage
Estimated Equity
$494,241
Purchase Details
Closed on
Oct 30, 1998
Sold by
Capstone Homes Inc
Bought by
Landowski Richard and Landowski Mary Anne E
Home Financials for this Owner
Home Financials are based on the most recent Mortgage that was taken out on this home.
Original Mortgage
$154,500
Interest Rate
6.61%
Mortgage Type
VA
Purchase Details
Closed on
Jul 14, 1997
Sold by
Pope Resources
Bought by
Capstone Homes Inc
Home Financials for this Owner
Home Financials are based on the most recent Mortgage that was taken out on this home.
Original Mortgage
$110,950
Interest Rate
7.83%
Create a Home Valuation Report for This Property
The Home Valuation Report is an in-depth analysis detailing your home's value as well as a comparison with similar homes in the area
Home Values in the Area
Average Home Value in this Area
Purchase History
| Date | Buyer | Sale Price | Title Company |
|---|---|---|---|
| Gallagher Robert E | $182,950 | Land Title Company | |
| Landowski Richard | $151,500 | Transnation Title Ins Co | |
| Capstone Homes Inc | -- | Pacific Nw Title |
Source: Public Records
Mortgage History
| Date | Status | Borrower | Loan Amount |
|---|---|---|---|
| Open | Gallagher Robert E | $177,461 | |
| Previous Owner | Landowski Richard | $154,500 | |
| Previous Owner | Capstone Homes Inc | $110,950 |
Source: Public Records
Tax History Compared to Growth
Tax History
| Year | Tax Paid | Tax Assessment Tax Assessment Total Assessment is a certain percentage of the fair market value that is determined by local assessors to be the total taxable value of land and additions on the property. | Land | Improvement |
|---|---|---|---|---|
| 2026 | $4,155 | $499,570 | $72,670 | $426,900 |
| 2025 | $4,155 | $473,310 | $59,230 | $414,080 |
| 2024 | $4,029 | $473,310 | $59,230 | $414,080 |
| 2023 | $4,003 | $473,310 | $59,230 | $414,080 |
| 2022 | $3,915 | $387,870 | $55,320 | $332,550 |
| 2021 | $3,857 | $361,810 | $54,110 | $307,700 |
| 2020 | $3,783 | $344,770 | $51,530 | $293,240 |
| 2019 | $3,115 | $310,950 | $50,080 | $260,870 |
| 2018 | $3,235 | $248,610 | $50,080 | $198,530 |
| 2017 | $2,748 | $248,610 | $50,080 | $198,530 |
| 2016 | $2,667 | $220,710 | $50,080 | $170,630 |
| 2015 | $2,574 | $215,790 | $50,080 | $165,710 |
| 2014 | -- | $212,510 | $50,080 | $162,430 |
| 2013 | -- | $221,430 | $52,720 | $168,710 |
Source: Public Records
Map
Nearby Homes
- 3341 SE Property Ct
- 5184 Granada Place SE
- 4590 Laguna Ln SE
- 2426 SE Celebrity Ct
- 3707 SE Chesterton Dr
- 3365 SE Carmae Dr
- 2430 SE Celebrity Ct
- 0 SE Sedgwick Rd Unit NWM2362855
- 0 SE Sedgwick Rd Unit 21804061
- 0 SE Sedgwick Rd Unit NWM2332354
- 4777 Okanogan Dr SE
- 5673 Bethel Rd SE Unit 28
- 2948 SE Alson Ct
- 5159 Country Club Way SE
- 6146 Windlass Ave SE
- 5544 Clover Valley Rd SE
- 6498 Skipper Ln SE
- 3131 SE Berger Ln
- 5230 Bethel Rd SE
- 1612 SE Sylvis Ln
- 6330 Grandridge Dr SE
- 6320 Greengate Place SE
- 3078 SE Grandhaven St
- 6324 Grandridge Dr SE
- 3066 SE Grandhaven St
- 6314 Greengate Place SE
- 6308 Greengate Place SE
- 6312 Grandridge Dr SE
- 6331 Grandridge Dr SE
- 3058 SE Grandhaven St
- 6294 Grandridge Dr SE
- 6343 Grandridge Dr SE
- 6325 Grandridge Dr SE
- 3073 SE Grandhaven St
- 3032 SE Grandhaven St
- 3024 SE Grandhaven St
- 3046 SE Grandhaven St
- 3067 SE Grandhaven St
- 6282 Grandridge Dr SE
- 6319 Grandridge Dr SE