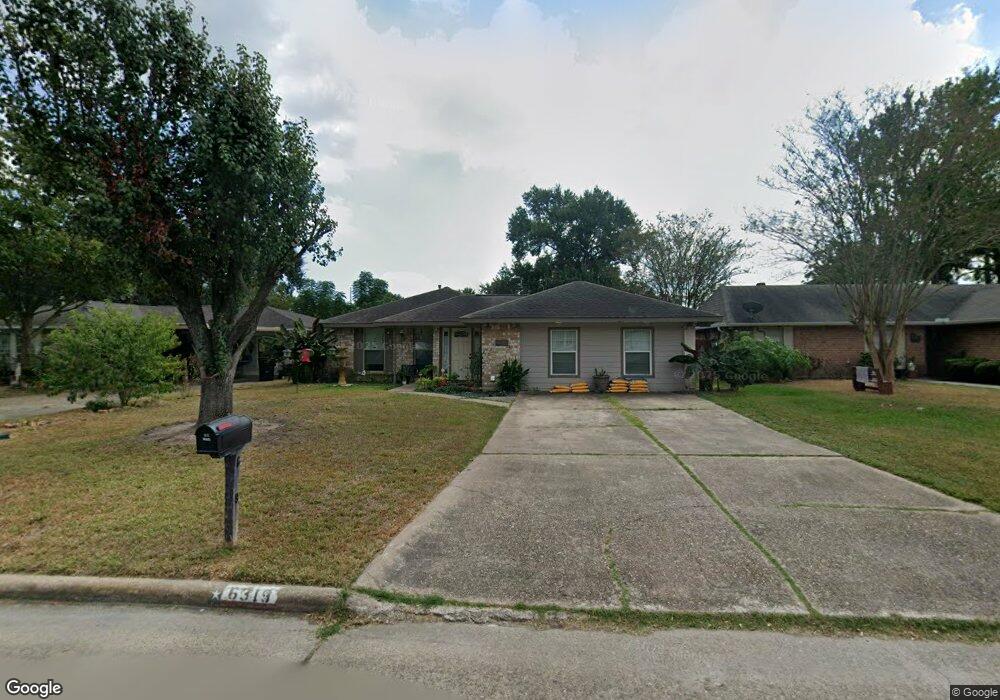
6319 Oaknut Dr Houston, TX 77088
Greater Inwood NeighborhoodEstimated Value: $192,000 - $238,000
3
Beds
2
Baths
1,687
Sq Ft
$127/Sq Ft
Est. Value
About This Home
This home is located at 6319 Oaknut Dr, Houston, TX 77088 and is currently estimated at $214,755, approximately $127 per square foot. 6319 Oaknut Dr is a home located in Harris County with nearby schools including Edward a Vines EC/Pre-K/K School, Ermel Elementary School, and Dr. Viola K. Garcia Middle School.
Ownership History
Date
Name
Owned For
Owner Type
Purchase Details
Closed on
Nov 17, 2022
Sold by
Carino Nubia and Carino Osvaldo
Bought by
Carino Carmelita A
Current Estimated Value
Purchase Details
Closed on
Dec 31, 2008
Sold by
Carino Sebastian L and Carino Carmelita A
Bought by
Carino Nubia
Home Financials for this Owner
Home Financials are based on the most recent Mortgage that was taken out on this home.
Original Mortgage
$90,250
Interest Rate
6.08%
Mortgage Type
Stand Alone Refi Refinance Of Original Loan
Purchase Details
Closed on
Apr 6, 1995
Sold by
Hud
Bought by
Carino Sebastian L and Carino Carmelita A
Home Financials for this Owner
Home Financials are based on the most recent Mortgage that was taken out on this home.
Original Mortgage
$45,000
Interest Rate
8.53%
Mortgage Type
FHA
Purchase Details
Closed on
Jul 5, 1994
Sold by
Lomas Mtg Partnership Lp
Bought by
Hud
Create a Home Valuation Report for This Property
The Home Valuation Report is an in-depth analysis detailing your home's value as well as a comparison with similar homes in the area
Home Values in the Area
Average Home Value in this Area
Purchase History
| Date | Buyer | Sale Price | Title Company |
|---|---|---|---|
| Carino Carmelita A | -- | None Listed On Document | |
| Carino Nubia | -- | Fidelity National Title | |
| Carino Sebastian L | $45,375 | -- | |
| Hud | -- | -- | |
| Lomas Mtg Partnership Lp | -- | -- |
Source: Public Records
Mortgage History
| Date | Status | Borrower | Loan Amount |
|---|---|---|---|
| Previous Owner | Carino Nubia | $90,250 | |
| Previous Owner | Carino Sebastian L | $45,000 |
Source: Public Records
Tax History Compared to Growth
Tax History
| Year | Tax Paid | Tax Assessment Tax Assessment Total Assessment is a certain percentage of the fair market value that is determined by local assessors to be the total taxable value of land and additions on the property. | Land | Improvement |
|---|---|---|---|---|
| 2025 | $629 | $200,571 | $51,292 | $149,279 |
| 2024 | $629 | $193,240 | $51,292 | $141,948 |
| 2023 | $629 | $185,280 | $51,292 | $133,988 |
| 2022 | $4,098 | $170,840 | $48,727 | $122,113 |
| 2021 | $3,216 | $128,013 | $15,518 | $112,495 |
| 2020 | $3,241 | $122,790 | $15,518 | $107,272 |
| 2019 | $2,763 | $99,839 | $11,546 | $88,293 |
| 2018 | $1,536 | $106,993 | $12,415 | $94,578 |
| 2017 | $2,838 | $106,993 | $12,415 | $94,578 |
| 2016 | $2,587 | $97,522 | $12,415 | $85,107 |
| 2015 | $2,298 | $97,522 | $12,415 | $85,107 |
| 2014 | $2,298 | $86,371 | $12,415 | $73,956 |
Source: Public Records
Map
Nearby Homes
- 6310 Silver Chalice Dr
- 6338 Maple Hill Dr
- 6931 Wagonwheel Ln
- 7218 Jadewood Dr Unit 770
- 6407 Deirdre Anne Dr
- 7146 Bayou Forest Dr
- 7014 Bent Branch Dr
- 7219 Ridge Oak Dr
- 6311 Fairwood Dr
- 6202 Wagonwheel Cir
- 6918 Bent Branch Dr
- 6430 Pirtlewood Cir
- 7402 Alabonson Rd Unit 506
- 7402 Alabonson Rd Unit 309
- 7402 Alabonson Rd Unit 510
- 7402 Alabonson Rd Unit 108
- 6902 Anson Point Ln
- 6303 Greenway Forest Ln
- 7606 Victory Dr
- 7727 Green Lawn Dr
- 6315 Oaknut Dr
- 6323 Oaknut Dr
- 6314 Acorn Forest Dr
- 6327 Oaknut Dr
- 6310 Acorn Forest Dr
- 6318 Acorn Forest Dr
- 6311 Oaknut Dr
- 6322 Acorn Forest Dr
- 6318 Oaknut Dr
- 6331 Oaknut Dr
- 6322 Oaknut Dr
- 6306 Acorn Forest Dr
- 6314 Oaknut Dr
- 6326 Acorn Forest Dr
- 6326 Oaknut Dr
- 6307 Oaknut Dr
- 6335 Oaknut Dr
- 6330 Oaknut Dr
- 6302 Acorn Forest Dr
- 6330 Acorn Forest Dr