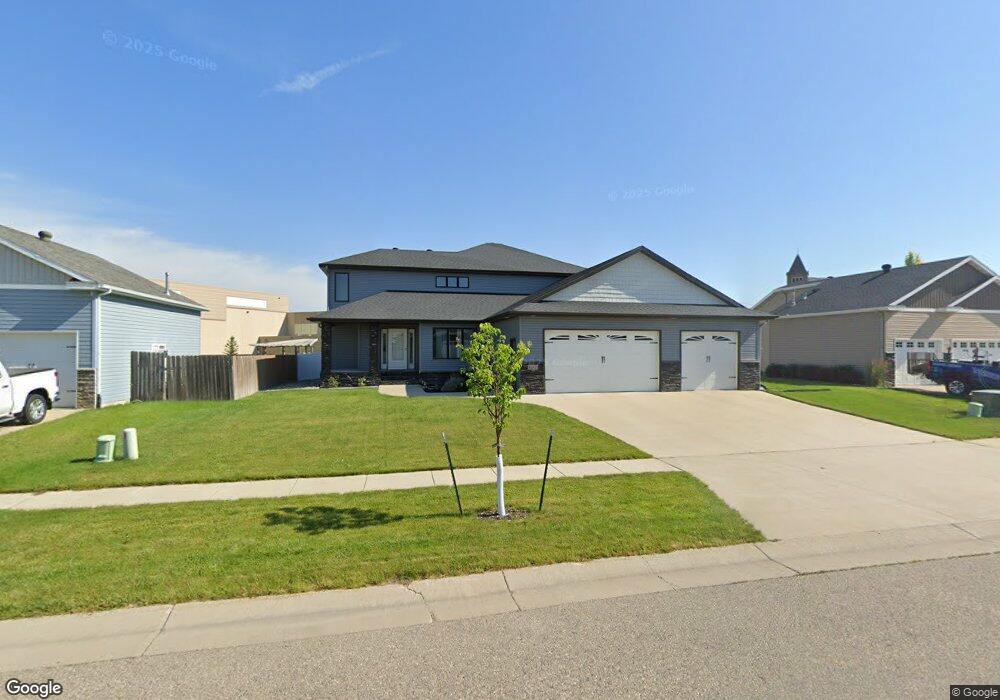
632 29th Ave E West Fargo, ND 58078
The Preserve NeighborhoodEstimated Value: $539,000
4
Beds
2
Baths
2,898
Sq Ft
$186/Sq Ft
Est. Value
About This Home
This home is located at 632 29th Ave E, West Fargo, ND 58078 and is currently estimated at $539,000, approximately $185 per square foot. 632 29th Ave E is a home with nearby schools including Freedom Elementary School, Liberty Middle School, and West Fargo Sheyenne High School.
Ownership History
Date
Name
Owned For
Owner Type
Purchase Details
Closed on
Oct 4, 2013
Sold by
Equity Home Builders Llc
Bought by
Plecity Kowalski Construction Inc
Current Estimated Value
Purchase Details
Closed on
May 15, 2013
Sold by
Rusty Goose Development Lllp
Bought by
Equity Home Builders Llc
Create a Home Valuation Report for This Property
The Home Valuation Report is an in-depth analysis detailing your home's value as well as a comparison with similar homes in the area
Home Values in the Area
Average Home Value in this Area
Purchase History
| Date | Buyer | Sale Price | Title Company |
|---|---|---|---|
| Plecity Kowalski Construction Inc | -- | Title Co | |
| Equity Home Builders Llc | -- | Title Co |
Source: Public Records
Tax History Compared to Growth
Tax History
| Year | Tax Paid | Tax Assessment Tax Assessment Total Assessment is a certain percentage of the fair market value that is determined by local assessors to be the total taxable value of land and additions on the property. | Land | Improvement |
|---|---|---|---|---|
| 2024 | $7,059 | $286,800 | $44,000 | $242,800 |
| 2023 | $7,131 | $270,350 | $44,000 | $226,350 |
| 2022 | $6,935 | $251,600 | $44,000 | $207,600 |
| 2021 | $6,589 | $235,300 | $36,000 | $199,300 |
| 2020 | $6,201 | $226,450 | $36,000 | $190,450 |
| 2019 | $6,726 | $228,150 | $36,000 | $192,150 |
| 2018 | $6,640 | $232,050 | $36,000 | $196,050 |
| 2017 | $6,412 | $234,050 | $36,000 | $198,050 |
| 2016 | $3,831 | $151,550 | $36,000 | $115,550 |
| 2015 | $3,425 | $125,750 | $28,100 | $97,650 |
| 2014 | $763 | $19,650 | $19,650 | $0 |
| 2013 | $3,643 | $14,250 | $14,250 | $0 |
Source: Public Records
Map
Nearby Homes
- 820 26th Ave E
- 2607 Mcleod Dr E
- 501 Foxtail Dr
- 445 E Foxtail Dr
- 433 Foxtail Dr
- 2432 Mcleod Dr E
- 2630 2nd St E
- 503 33rd Way E Unit B
- 2836 River's Bend Dr E
- 3405 4th St E
- 3037 Claire Dr E
- 436 35th Ave E
- 3371 1st St
- 3502 8th St E
- 3463 Loberg Dr
- 3479 Loberg Ln
- 360 32nd Ave W Unit 608
- 360 32nd Ave W Unit 508
- 154 W Beaton Dr
- 1811 7th St E