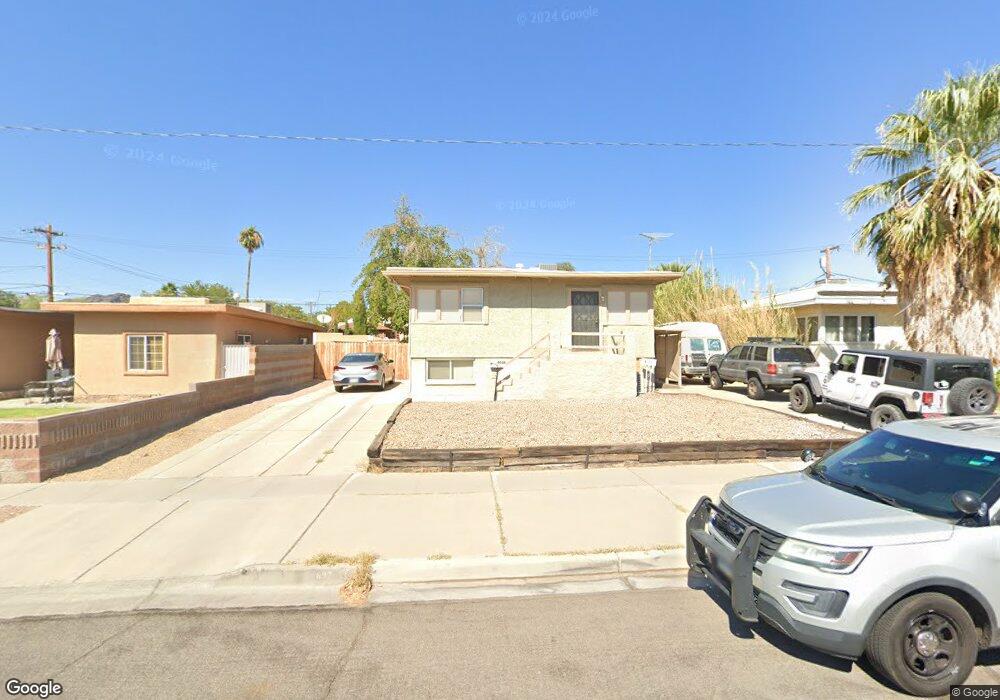
632 5th St Boulder City, NV 89005
Estimated Value: $436,141 - $543,000
4
Beds
2
Baths
1,444
Sq Ft
$341/Sq Ft
Est. Value
About This Home
This home is located at 632 5th St, Boulder City, NV 89005 and is currently estimated at $491,785, approximately $340 per square foot. 632 5th St is a home located in Clark County with nearby schools including Andrew Mitchell Elementary School, Martha P. King Elementary School, and Elton M. & Madelaine E. Garrett Junior High School.
Ownership History
Date
Name
Owned For
Owner Type
Purchase Details
Closed on
Dec 18, 2018
Sold by
Lowell Mary Ann E
Bought by
Lowell Richard D and Lowell Mary Ann E
Current Estimated Value
Home Financials for this Owner
Home Financials are based on the most recent Mortgage that was taken out on this home.
Original Mortgage
$97,500
Interest Rate
4.9%
Mortgage Type
New Conventional
Purchase Details
Closed on
Jul 15, 2011
Sold by
Lowell Mary Ann E
Bought by
Richard D & Mary Ann E Lowell Living Tru
Purchase Details
Closed on
Jul 18, 2003
Sold by
Lowell Richard D
Bought by
Lowell Mary Ann E
Purchase Details
Closed on
Mar 22, 1996
Sold by
Locascio Mary Ann E
Bought by
Lowell Mary Ann E
Home Financials for this Owner
Home Financials are based on the most recent Mortgage that was taken out on this home.
Original Mortgage
$72,000
Interest Rate
6.98%
Create a Home Valuation Report for This Property
The Home Valuation Report is an in-depth analysis detailing your home's value as well as a comparison with similar homes in the area
Home Values in the Area
Average Home Value in this Area
Purchase History
| Date | Buyer | Sale Price | Title Company |
|---|---|---|---|
| Lowell Richard D | -- | Amrock Inc | |
| Lowell Mary Ann E | -- | Amrock Inc | |
| Richard D & Mary Ann E Lowell Living Tru | -- | None Available | |
| Lowell Mary Ann E | -- | Equity Title Of Nevada | |
| Lowell Mary Ann E | -- | Equity Title Of Nevada | |
| Lowell Mary Ann E | -- | Old Republic Title Company |
Source: Public Records
Mortgage History
| Date | Status | Borrower | Loan Amount |
|---|---|---|---|
| Closed | Lowell Mary Ann E | $97,500 | |
| Closed | Lowell Mary Ann E | $72,000 |
Source: Public Records
Tax History Compared to Growth
Tax History
| Year | Tax Paid | Tax Assessment Tax Assessment Total Assessment is a certain percentage of the fair market value that is determined by local assessors to be the total taxable value of land and additions on the property. | Land | Improvement |
|---|---|---|---|---|
| 2025 | $1,126 | $69,575 | $52,500 | $17,075 |
| 2024 | $1,043 | $69,575 | $52,500 | $17,075 |
| 2023 | $703 | $51,516 | $36,750 | $14,766 |
| 2022 | $966 | $46,970 | $33,250 | $13,720 |
| 2021 | $894 | $39,482 | $28,700 | $10,782 |
| 2020 | $830 | $39,740 | $28,700 | $11,040 |
| 2019 | $778 | $36,954 | $26,250 | $10,704 |
| 2018 | $742 | $32,715 | $22,750 | $9,965 |
| 2017 | $712 | $27,282 | $17,500 | $9,782 |
| 2016 | $703 | $27,062 | $17,500 | $9,562 |
| 2015 | $701 | $26,720 | $17,500 | $9,220 |
| 2014 | $688 | $26,995 | $17,500 | $9,495 |
Source: Public Records
Map
Nearby Homes