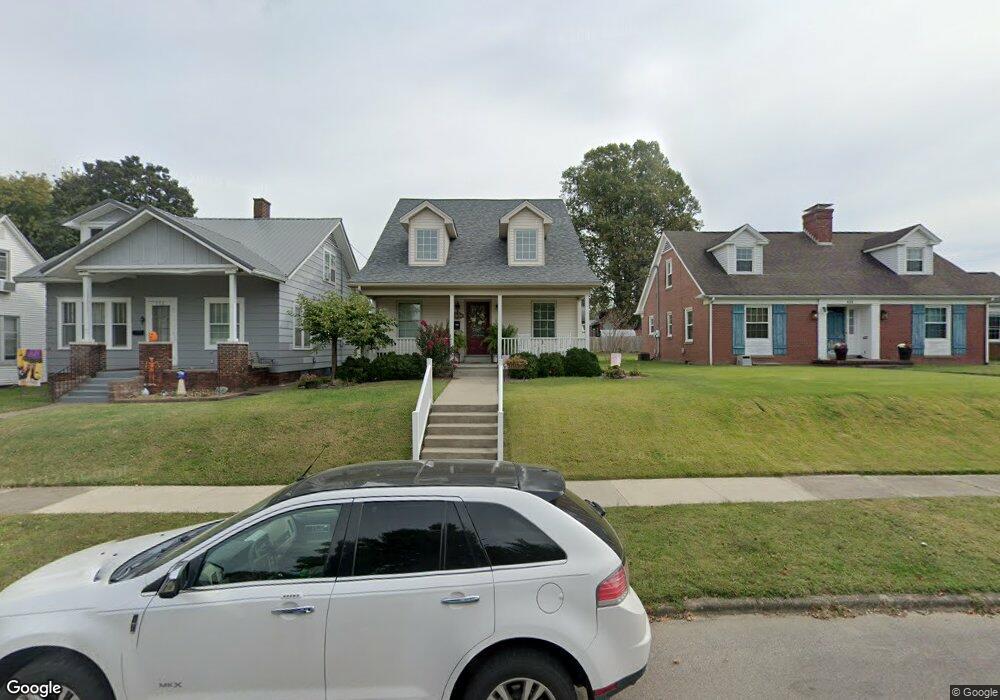
632 9th St Tell City, IN 47586
Estimated Value: $121,000 - $165,923
3
Beds
1
Bath
1,082
Sq Ft
$132/Sq Ft
Est. Value
About This Home
This home is located at 632 9th St, Tell City, IN 47586 and is currently estimated at $142,981, approximately $132 per square foot. 632 9th St is a home located in Perry County with nearby schools including William Tell Elementary School, Tell City Junior/Senior High School, and Agape Christian Academy.
Ownership History
Date
Name
Owned For
Owner Type
Purchase Details
Closed on
Jul 19, 2012
Sold by
Lincoln Hills Development Corp
Bought by
Tsantis Stephanie A
Current Estimated Value
Home Financials for this Owner
Home Financials are based on the most recent Mortgage that was taken out on this home.
Original Mortgage
$106,300
Outstanding Balance
$73,273
Interest Rate
3.64%
Mortgage Type
New Conventional
Estimated Equity
$69,708
Purchase Details
Closed on
Jan 7, 2010
Sold by
Fifth Third Mortgage Company
Bought by
Federal National Mortgage Association
Purchase Details
Closed on
Dec 7, 2009
Sold by
Gilbert Timothy J
Bought by
Fifth Third Mortgage Corp
Create a Home Valuation Report for This Property
The Home Valuation Report is an in-depth analysis detailing your home's value as well as a comparison with similar homes in the area
Home Values in the Area
Average Home Value in this Area
Purchase History
| Date | Buyer | Sale Price | Title Company |
|---|---|---|---|
| Tsantis Stephanie A | -- | None Available | |
| Federal National Mortgage Association | -- | None Available | |
| Fifth Third Mortgage Corp | $54,189 | None Available |
Source: Public Records
Mortgage History
| Date | Status | Borrower | Loan Amount |
|---|---|---|---|
| Open | Tsantis Stephanie A | $106,300 |
Source: Public Records
Tax History Compared to Growth
Tax History
| Year | Tax Paid | Tax Assessment Tax Assessment Total Assessment is a certain percentage of the fair market value that is determined by local assessors to be the total taxable value of land and additions on the property. | Land | Improvement |
|---|---|---|---|---|
| 2024 | $1,159 | $111,900 | $6,200 | $105,700 |
| 2023 | $1,183 | $114,100 | $6,200 | $107,900 |
| 2022 | $1,070 | $109,100 | $6,200 | $102,900 |
| 2021 | $1,003 | $102,200 | $5,200 | $97,000 |
| 2020 | $939 | $95,800 | $5,200 | $90,600 |
| 2019 | $975 | $99,600 | $5,000 | $94,600 |
| 2018 | $1,039 | $99,700 | $5,000 | $94,700 |
| 2017 | $1,025 | $98,100 | $5,000 | $93,100 |
| 2016 | $1,035 | $99,100 | $5,000 | $94,100 |
| 2014 | $1,021 | $97,700 | $5,200 | $92,500 |
| 2013 | $1,021 | $95,300 | $5,200 | $90,100 |
Source: Public Records
Map
Nearby Homes