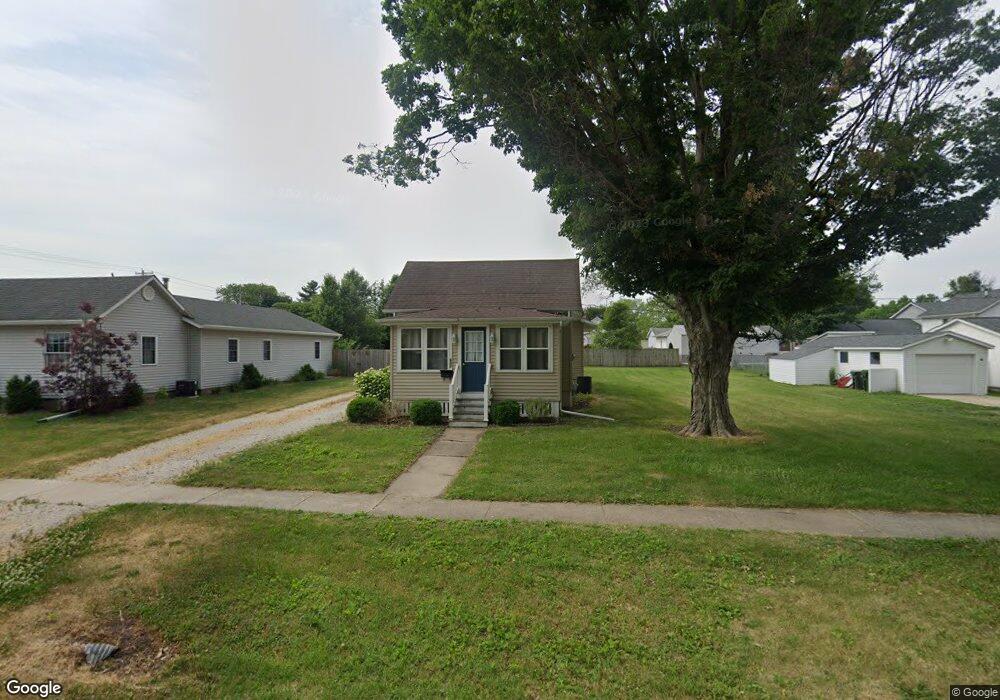
632 E Park St Geneseo, IL 61254
Estimated Value: $115,593 - $135,000
3
Beds
--
Bath
785
Sq Ft
$161/Sq Ft
Est. Value
About This Home
This home is located at 632 E Park St, Geneseo, IL 61254 and is currently estimated at $126,148, approximately $160 per square foot. 632 E Park St is a home located in Henry County with nearby schools including Geneseo High School and St. Malachy School.
Ownership History
Date
Name
Owned For
Owner Type
Purchase Details
Closed on
Mar 27, 2018
Sold by
Mighell Cody and Mighell Courtney J
Bought by
Lafrinieree Christopher S
Current Estimated Value
Home Financials for this Owner
Home Financials are based on the most recent Mortgage that was taken out on this home.
Original Mortgage
$92,251
Outstanding Balance
$79,371
Interest Rate
4.46%
Mortgage Type
VA
Estimated Equity
$46,777
Purchase Details
Closed on
Nov 2, 2012
Sold by
Hancock Steven A and Hancock Cindy J
Bought by
Mighell Cody
Home Financials for this Owner
Home Financials are based on the most recent Mortgage that was taken out on this home.
Original Mortgage
$87,712
Interest Rate
3.32%
Mortgage Type
New Conventional
Purchase Details
Closed on
Sep 8, 2010
Sold by
Soderholm Linda K and Golden Linda K
Bought by
Hancock Steven A and Hancock Cindy J
Create a Home Valuation Report for This Property
The Home Valuation Report is an in-depth analysis detailing your home's value as well as a comparison with similar homes in the area
Home Values in the Area
Average Home Value in this Area
Purchase History
| Date | Buyer | Sale Price | Title Company |
|---|---|---|---|
| Lafrinieree Christopher S | $92,500 | Western Illinois Title | |
| Mighell Cody | $85,000 | None Available | |
| Hancock Steven A | $25,000 | None Available |
Source: Public Records
Mortgage History
| Date | Status | Borrower | Loan Amount |
|---|---|---|---|
| Open | Lafrinieree Christopher S | $92,251 | |
| Previous Owner | Mighell Cody | $87,712 |
Source: Public Records
Tax History Compared to Growth
Tax History
| Year | Tax Paid | Tax Assessment Tax Assessment Total Assessment is a certain percentage of the fair market value that is determined by local assessors to be the total taxable value of land and additions on the property. | Land | Improvement |
|---|---|---|---|---|
| 2024 | $2,718 | $39,443 | $4,993 | $34,450 |
| 2023 | $2,373 | $35,922 | $4,547 | $31,375 |
| 2022 | $2,226 | $33,385 | $4,226 | $29,159 |
| 2021 | $2,168 | $32,539 | $4,119 | $28,420 |
| 2020 | $2,162 | $32,841 | $4,157 | $28,684 |
| 2019 | $2,089 | $32,476 | $4,111 | $28,365 |
| 2018 | $2,431 | $30,696 | $3,886 | $26,810 |
| 2017 | $1,828 | $29,919 | $3,788 | $26,131 |
| 2016 | $1,490 | $24,210 | $3,692 | $20,518 |
| 2015 | $1,183 | $24,162 | $3,685 | $20,477 |
| 2013 | $1,183 | $28,558 | $3,616 | $24,942 |
Source: Public Records
Map
Nearby Homes