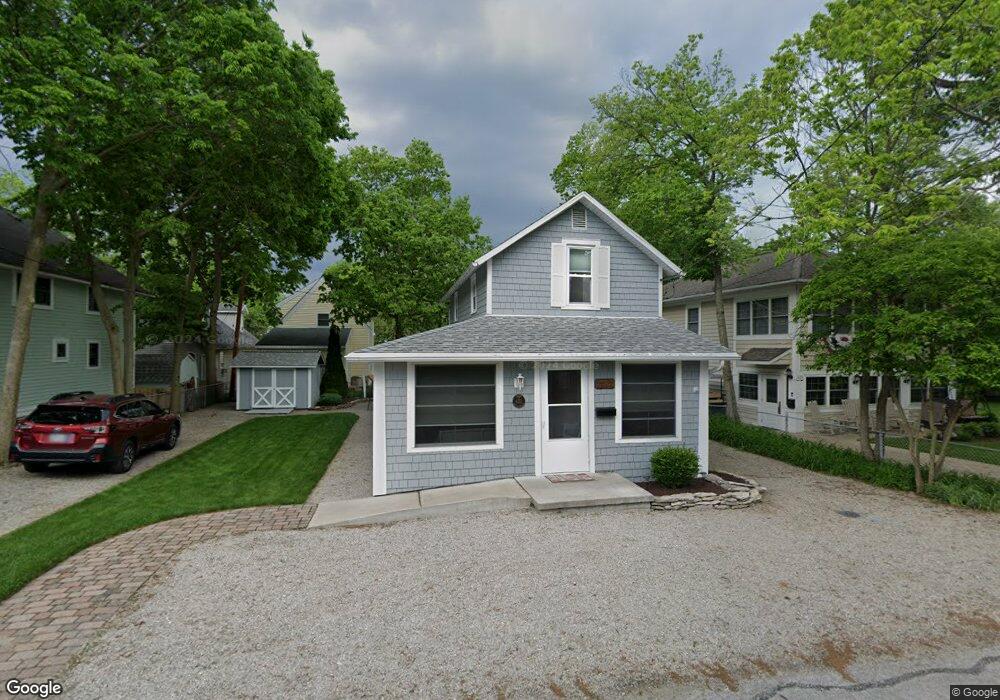
632 Maple Ave Lakeside Marblehead, OH 43440
Estimated Value: $428,911 - $624,000
3
Beds
2
Baths
1,345
Sq Ft
$424/Sq Ft
Est. Value
About This Home
This home is located at 632 Maple Ave, Lakeside Marblehead, OH 43440 and is currently estimated at $570,478, approximately $424 per square foot. 632 Maple Ave is a home located in Ottawa County with nearby schools including Danbury Middle School and Danbury High School.
Ownership History
Date
Name
Owned For
Owner Type
Purchase Details
Closed on
Aug 15, 2011
Sold by
Glaser Frederick M
Bought by
Bradford Herbert F and Bradford Kathleen D
Current Estimated Value
Home Financials for this Owner
Home Financials are based on the most recent Mortgage that was taken out on this home.
Original Mortgage
$188,000
Outstanding Balance
$129,987
Interest Rate
4.54%
Mortgage Type
New Conventional
Estimated Equity
$440,491
Purchase Details
Closed on
Aug 30, 2004
Sold by
Burks Frank E and Burks Barbara Ann
Bought by
Davis Ruth G
Home Financials for this Owner
Home Financials are based on the most recent Mortgage that was taken out on this home.
Original Mortgage
$165,000
Interest Rate
4.62%
Mortgage Type
Purchase Money Mortgage
Purchase Details
Closed on
Oct 15, 1991
Sold by
Burks Frank E and Arbara Ann
Bought by
Burks Frank E and Barbara Ann
Create a Home Valuation Report for This Property
The Home Valuation Report is an in-depth analysis detailing your home's value as well as a comparison with similar homes in the area
Home Values in the Area
Average Home Value in this Area
Purchase History
| Date | Buyer | Sale Price | Title Company |
|---|---|---|---|
| Bradford Herbert F | $235,000 | Attorney | |
| Davis Ruth G | $225,000 | -- | |
| Burks Frank E | $80,000 | -- |
Source: Public Records
Mortgage History
| Date | Status | Borrower | Loan Amount |
|---|---|---|---|
| Open | Bradford Herbert F | $188,000 | |
| Previous Owner | Davis Ruth G | $165,000 |
Source: Public Records
Tax History Compared to Growth
Tax History
| Year | Tax Paid | Tax Assessment Tax Assessment Total Assessment is a certain percentage of the fair market value that is determined by local assessors to be the total taxable value of land and additions on the property. | Land | Improvement |
|---|---|---|---|---|
| 2024 | $4,366 | $128,100 | $64,008 | $64,092 |
| 2023 | $4,366 | $92,446 | $37,958 | $54,488 |
| 2022 | $3,192 | $92,446 | $37,958 | $54,488 |
| 2021 | $3,201 | $92,450 | $37,960 | $54,490 |
| 2020 | $2,903 | $79,350 | $37,210 | $42,140 |
| 2019 | $2,686 | $79,350 | $37,210 | $42,140 |
| 2018 | $2,850 | $79,350 | $37,210 | $42,140 |
| 2016 | $2,675 | $74,170 | $34,770 | $39,400 |
| 2015 | $2,688 | $74,170 | $34,770 | $39,400 |
| 2014 | $1,351 | $72,870 | $34,770 | $38,100 |
| 2013 | $1,204 | $69,430 | $34,770 | $34,660 |
Source: Public Records
Map
Nearby Homes