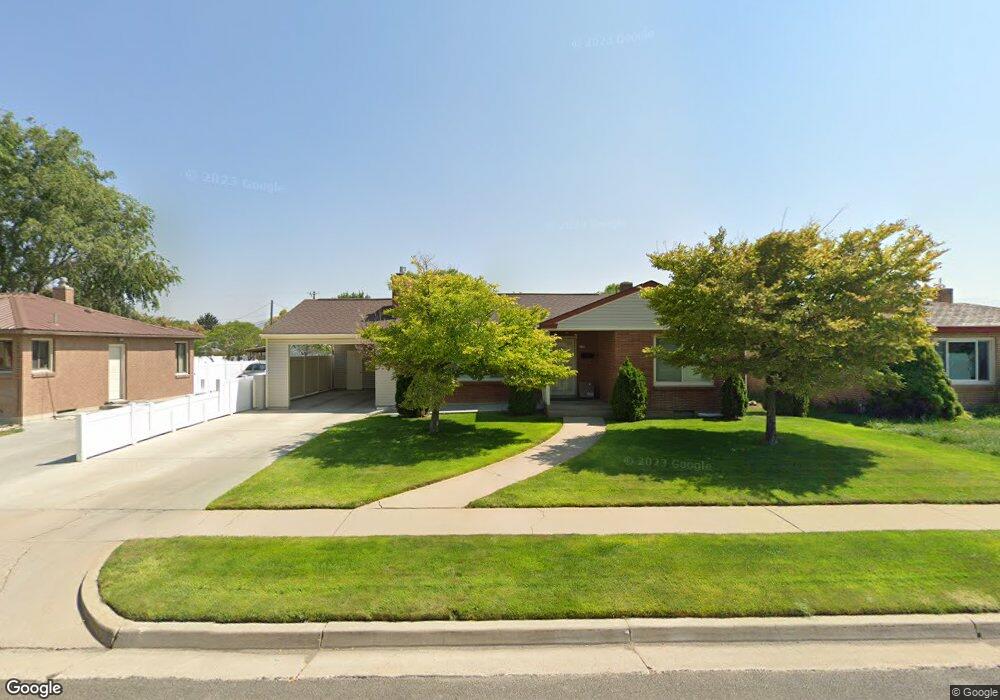
632 N 200 E Tremonton, UT 84337
Estimated Value: $338,000 - $391,000
--
Bed
--
Bath
848
Sq Ft
$429/Sq Ft
Est. Value
About This Home
This home is located at 632 N 200 E, Tremonton, UT 84337 and is currently estimated at $363,879, approximately $429 per square foot. 632 N 200 E is a home located in Box Elder County with nearby schools including North Park School, Bear River Middle School, and Alice C. Harris Intermediate School.
Ownership History
Date
Name
Owned For
Owner Type
Purchase Details
Closed on
Mar 29, 2018
Sold by
Riedesel Cody Dallen
Bought by
Francis Trace
Current Estimated Value
Home Financials for this Owner
Home Financials are based on the most recent Mortgage that was taken out on this home.
Original Mortgage
$185,400
Outstanding Balance
$161,457
Interest Rate
5%
Mortgage Type
Adjustable Rate Mortgage/ARM
Estimated Equity
$202,422
Purchase Details
Closed on
Aug 10, 2016
Sold by
Bowcutt Blake Ban
Bought by
Riedesel Cody Dallen
Home Financials for this Owner
Home Financials are based on the most recent Mortgage that was taken out on this home.
Original Mortgage
$154,156
Interest Rate
3.75%
Mortgage Type
FHA
Purchase Details
Closed on
Apr 23, 2010
Sold by
Thompson Kris G and Thompson Bambi
Bought by
Bowcutt Blake Bart
Home Financials for this Owner
Home Financials are based on the most recent Mortgage that was taken out on this home.
Original Mortgage
$143,700
Interest Rate
4.91%
Mortgage Type
New Conventional
Create a Home Valuation Report for This Property
The Home Valuation Report is an in-depth analysis detailing your home's value as well as a comparison with similar homes in the area
Home Values in the Area
Average Home Value in this Area
Purchase History
| Date | Buyer | Sale Price | Title Company |
|---|---|---|---|
| Francis Trace | -- | Northern Title Company | |
| Riedesel Cody Dallen | -- | Northern Title Company | |
| Bowcutt Blake Bart | -- | -- |
Source: Public Records
Mortgage History
| Date | Status | Borrower | Loan Amount |
|---|---|---|---|
| Open | Francis Trace | $185,400 | |
| Previous Owner | Riedesel Cody Dallen | $154,156 | |
| Previous Owner | Bowcutt Blake Bart | $143,700 |
Source: Public Records
Tax History Compared to Growth
Tax History
| Year | Tax Paid | Tax Assessment Tax Assessment Total Assessment is a certain percentage of the fair market value that is determined by local assessors to be the total taxable value of land and additions on the property. | Land | Improvement |
|---|---|---|---|---|
| 2025 | $2,009 | $347,584 | $105,000 | $242,584 |
| 2024 | $2,009 | $347,945 | $105,000 | $242,945 |
| 2023 | $2,113 | $359,141 | $100,000 | $259,141 |
| 2022 | $1,895 | $183,737 | $16,500 | $167,237 |
| 2021 | $1,445 | $197,338 | $30,000 | $167,338 |
| 2020 | $1,281 | $197,338 | $30,000 | $167,338 |
| 2019 | $1,192 | $97,948 | $16,500 | $81,448 |
| 2018 | $1,008 | $75,637 | $13,750 | $61,887 |
| 2017 | $1,041 | $137,521 | $13,750 | $112,521 |
| 2016 | $1,025 | $72,690 | $13,750 | $58,940 |
| 2015 | $933 | $67,332 | $13,750 | $53,582 |
| 2014 | $933 | $64,780 | $13,750 | $51,030 |
| 2013 | -- | $64,781 | $13,338 | $51,443 |
Source: Public Records
Map
Nearby Homes