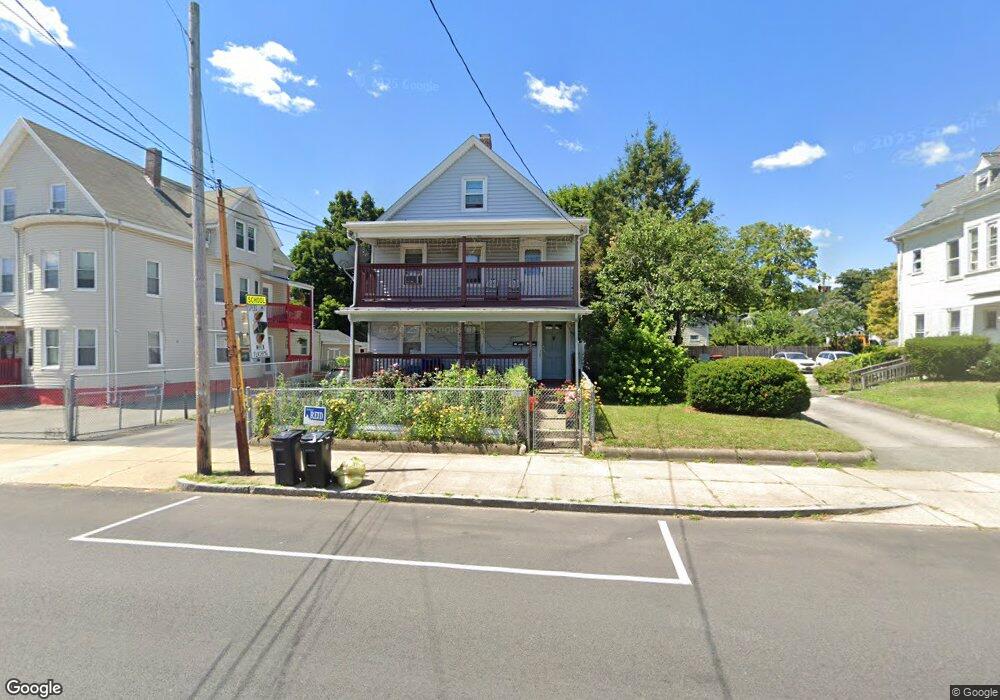
632 N Main St Brockton, MA 02301
Estimated Value: $645,061 - $833,000
4
Beds
2
Baths
2,494
Sq Ft
$300/Sq Ft
Est. Value
About This Home
This home is located at 632 N Main St, Brockton, MA 02301 and is currently estimated at $747,015, approximately $299 per square foot. 632 N Main St is a home located in Plymouth County with nearby schools including Louis F Angelo Elementary School, Raymond K-8 Elementary School, and Manthala George Jr. School.
Ownership History
Date
Name
Owned For
Owner Type
Purchase Details
Closed on
Mar 14, 1989
Sold by
Newport Patrick O
Bought by
Pique Felix M
Current Estimated Value
Home Financials for this Owner
Home Financials are based on the most recent Mortgage that was taken out on this home.
Original Mortgage
$128,000
Interest Rate
10.55%
Mortgage Type
Purchase Money Mortgage
Create a Home Valuation Report for This Property
The Home Valuation Report is an in-depth analysis detailing your home's value as well as a comparison with similar homes in the area
Home Values in the Area
Average Home Value in this Area
Purchase History
| Date | Buyer | Sale Price | Title Company |
|---|---|---|---|
| Pique Felix M | $160,000 | -- |
Source: Public Records
Mortgage History
| Date | Status | Borrower | Loan Amount |
|---|---|---|---|
| Open | Pique Felix M | $100,000 | |
| Closed | Pique Felix M | $128,000 | |
| Previous Owner | Pique Felix M | $102,000 |
Source: Public Records
Tax History Compared to Growth
Tax History
| Year | Tax Paid | Tax Assessment Tax Assessment Total Assessment is a certain percentage of the fair market value that is determined by local assessors to be the total taxable value of land and additions on the property. | Land | Improvement |
|---|---|---|---|---|
| 2025 | $7,508 | $620,000 | $138,000 | $482,000 |
| 2024 | $7,210 | $599,800 | $138,000 | $461,800 |
| 2023 | $6,619 | $509,900 | $102,900 | $407,000 |
| 2022 | $6,689 | $478,800 | $93,400 | $385,400 |
| 2021 | $6,120 | $422,100 | $77,400 | $344,700 |
| 2020 | $5,333 | $352,000 | $72,800 | $279,200 |
| 2019 | $5,147 | $331,200 | $70,700 | $260,500 |
| 2018 | $4,643 | $289,100 | $70,700 | $218,400 |
| 2017 | $4,226 | $262,500 | $70,700 | $191,800 |
| 2016 | $3,807 | $219,300 | $68,500 | $150,800 |
| 2015 | $3,240 | $178,500 | $68,500 | $110,000 |
| 2014 | $3,211 | $177,100 | $68,500 | $108,600 |
Source: Public Records
Map
Nearby Homes
- 628 N Main St
- 624 N Main St Unit 3
- 622 N Main St
- 622 N Main St Unit 3
- 622 N Main St Unit 2
- 638 N Main St
- 638 N Main St Unit 3 North
- 11 Lansdowne St
- 15 Lansdowne St
- 20 Upland Rd
- 633 N Main St
- 19 Lansdowne St
- 637 N Main St
- 650 N Main St Unit 7
- 650 N Main St
- 5 Upland Rd Unit 5
- 5 Upland Rd Unit 3 Top
- 643 N Main St
- 643 N Main St Unit 2
- 26 Upland Rd