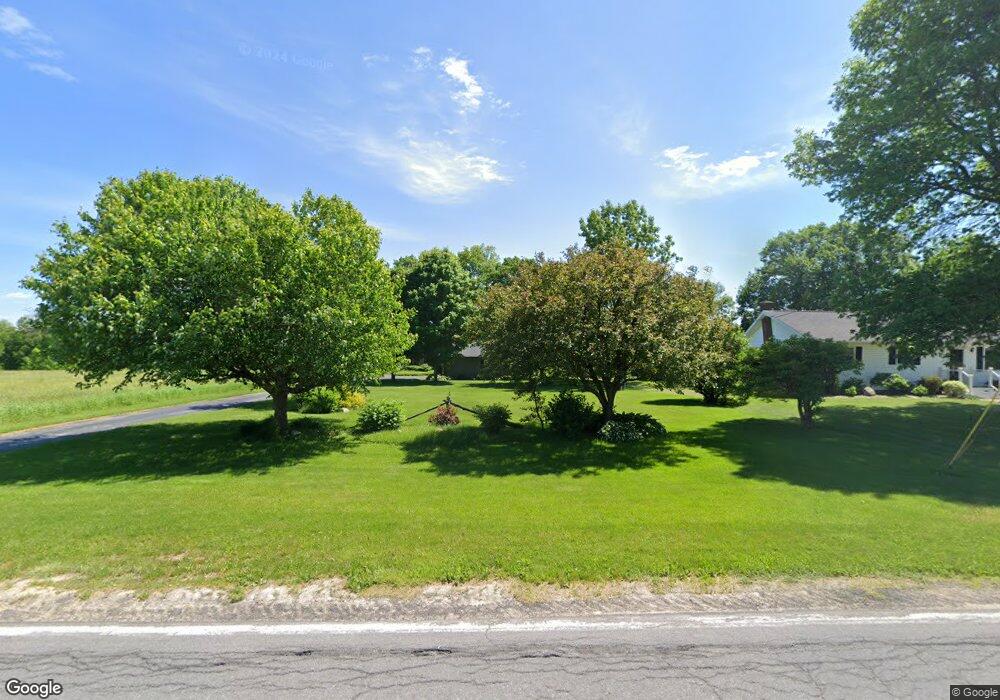
632 N Racquette River Rd Massena, NY 13662
Estimated Value: $120,000 - $331,000
3
Beds
3
Baths
1,860
Sq Ft
$111/Sq Ft
Est. Value
About This Home
This home is located at 632 N Racquette River Rd, Massena, NY 13662 and is currently estimated at $205,901, approximately $110 per square foot. 632 N Racquette River Rd is a home located in St. Lawrence County with nearby schools including Massena Senior High School, Holy Name of Jesus Academy, and The Holy Name of Jesus Academy.
Ownership History
Date
Name
Owned For
Owner Type
Purchase Details
Closed on
Oct 19, 2011
Sold by
Deshaies Randy
Bought by
Hillis David
Current Estimated Value
Home Financials for this Owner
Home Financials are based on the most recent Mortgage that was taken out on this home.
Original Mortgage
$161,500
Outstanding Balance
$110,415
Interest Rate
4.15%
Mortgage Type
New Conventional
Estimated Equity
$95,486
Purchase Details
Closed on
Oct 12, 2011
Sold by
Deshaies Randy J and Deshaies Cindy L
Bought by
Hillis David and Hillis Barbara
Home Financials for this Owner
Home Financials are based on the most recent Mortgage that was taken out on this home.
Original Mortgage
$161,500
Outstanding Balance
$110,415
Interest Rate
4.15%
Mortgage Type
New Conventional
Estimated Equity
$95,486
Purchase Details
Closed on
Aug 20, 2003
Sold by
Mccallum Filomena
Bought by
Deshaies Randy J
Create a Home Valuation Report for This Property
The Home Valuation Report is an in-depth analysis detailing your home's value as well as a comparison with similar homes in the area
Home Values in the Area
Average Home Value in this Area
Purchase History
| Date | Buyer | Sale Price | Title Company |
|---|---|---|---|
| Hillis David | $170,000 | Mathew P. Duprey | |
| Hillis David | $170,000 | None Available | |
| Deshaies Randy J | $54,000 | Daniel Pease |
Source: Public Records
Mortgage History
| Date | Status | Borrower | Loan Amount |
|---|---|---|---|
| Open | Hillis David | $161,500 |
Source: Public Records
Tax History Compared to Growth
Tax History
| Year | Tax Paid | Tax Assessment Tax Assessment Total Assessment is a certain percentage of the fair market value that is determined by local assessors to be the total taxable value of land and additions on the property. | Land | Improvement |
|---|---|---|---|---|
| 2024 | $2,980 | $87,000 | $18,700 | $68,300 |
| 2023 | $2,915 | $87,000 | $18,700 | $68,300 |
| 2022 | $2,813 | $87,000 | $18,700 | $68,300 |
| 2021 | $2,830 | $87,000 | $18,700 | $68,300 |
| 2020 | $2,269 | $87,000 | $18,700 | $68,300 |
| 2019 | $2,277 | $87,000 | $18,700 | $68,300 |
| 2018 | $2,277 | $87,000 | $18,700 | $68,300 |
| 2017 | $2,266 | $87,000 | $18,700 | $68,300 |
| 2016 | $2,236 | $87,000 | $18,700 | $68,300 |
| 2015 | -- | $87,000 | $18,700 | $68,300 |
| 2014 | -- | $87,000 | $18,700 | $68,300 |
Source: Public Records
Map
Nearby Homes
- 159 County Route 46
- 847 Cr 37
- 0 N Racquette River Rd
- 319 County Route 46
- 7 Meadowview Ln
- 16 Shoreline Dr
- 341 County Route 37
- 0 Old Orchard Rd Prvt Unit 49742
- 3 River Ln
- 255 Reed Dr
- 642 County Route 42
- 5 Bucktown Rd
- 000 Victory Rd
- 201 E Hatfield St
- 103 Larue Rd
- 14 Williams St
- 37 Bayley Rd
- 34, 34 1/2 Glenn St
- 29 Malby Ave
- 30 Urban Dr
- 626 N Racquette River Rd
- 684 N Racquette River Rd
- 616 N Racquette River Rd
- 614 N Racquette River Rd
- 647 N Racquette River Rd
- 650 N Racquette River Rd
- 613 N Racquette River Rd
- 609 N Racquette River Rd
- 656 N Racquette River Rd
- 602 N Racquette River Rd
- 00 County Route 46
- 662 N Racquette River Rd
- 662 N Raquette River Rd
- 591 N Racquette River Rd
- 674 N Racquette River Rd
- 14 Oneil Rd
- 6 Oneil Rd
- 678 N Racquette River Rd
- 679 N Racquette River Rd
- 0 Co Route 37 Unit 37971